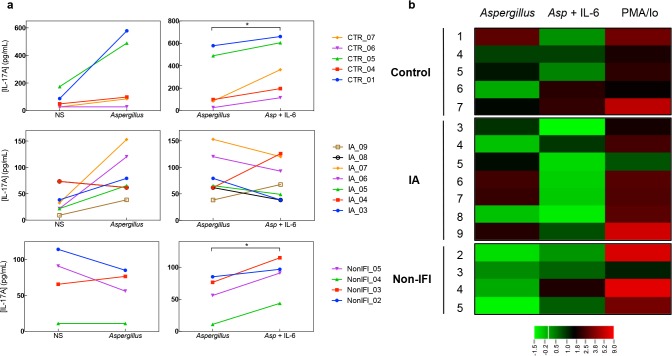
Fig 3. Effect of IL-6 on Aspergillus-induced IL-17 production.
(a) Levels IL-17 (pg/mL) measured by immunoassay on culture supernatants are shown. Left panels show the levels of IL-17 in supernatant of peripheral blood mononuclear cells (PBMCs) incubated in media alone (NS) or in the presence of Aspergillus fumigatus lysate (50 mg/mL) for 72hr. Right panels correspond to levels of IL-17 in supernatant of PBMCs incubated with Aspergillus fumigatus alone or in the presence of recombinant human IL-6 (100ng/mL). Detectable Aspergillus-induced cytokine production was defined as >2.5 fold change from baseline. Each line corresponds to an individual patient or control as indicated by the study ID number on the right. *p<0.05 using the paired two-tailed Student’s t-test. (b) Heat map for log2 scale of IL-17 levels fold change. Each row on the heat map corresponds to an individual patient or control as indicated by the study ID number on the left. Fold change was calculated by dividing the IL-17 levels produced in response to Phorbol 12-Myristate 13-Acetate and ionomycin (50 ng/mL and 1 mg/mL, respectively; depicted as PMA/Io) or Aspergillus fumigatus (50 mg/mL; depicted as Aspergillus) stimulation by those of non-stimulated cells; and by dividing IL-17 levels in response to Aspergillus (50 mg/mL) plus IL-6 (100ng/mL) by those of cells stimulated with Aspergillus lysate alone (depicted as Asp + IL-6). Heat map color scale is showed in the bottom.

