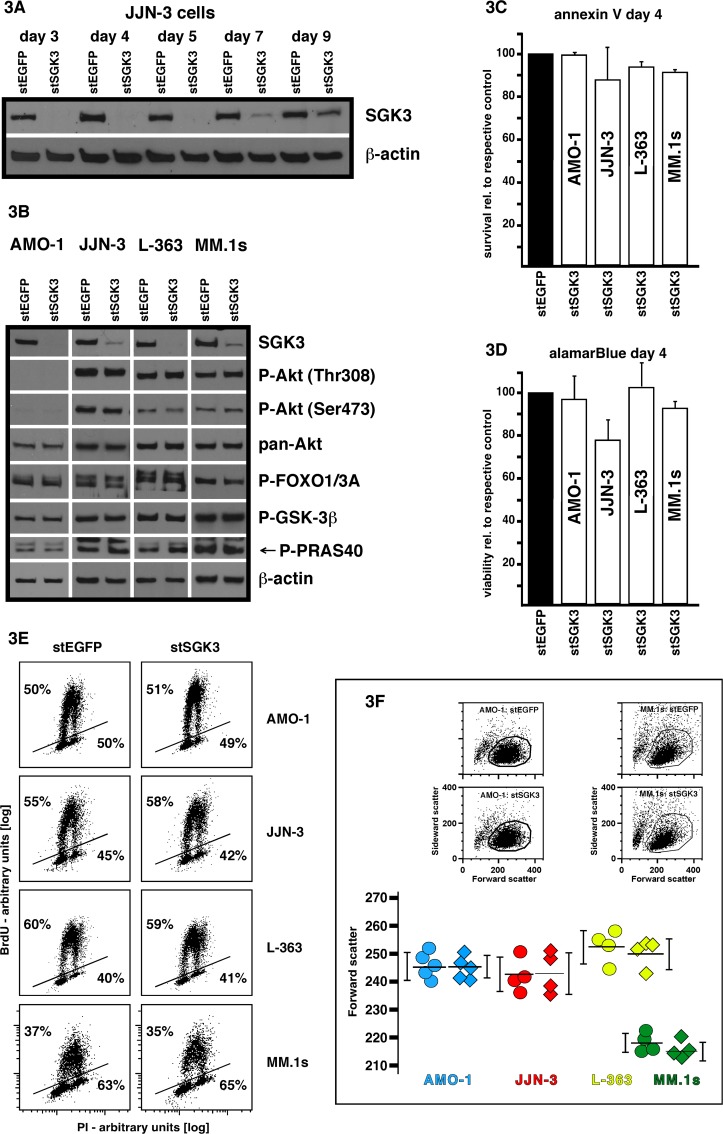
Fig 3. SGK3 knockdown in MM cell lines.
A) Western blot showing time-dependence of stealth siRNA-mediated SGK3 (stSGK3) depletion in electroporated JJN-3 cells. A stealth siRNA against enhanced green fluorescent protein (stEGFP) was used in control electroporations. B) SGK3 knockdown and phosphorylation levels of Akt and of potential SGK3 downstream substrates in stEGFP vs. stSGK3 transfected MM cell lines. Cells were harvested at day 3 post-electroporation. For each cell line two gels were run and the representative β-actin control derives from the gel that was also stained for P-Akt (Thr308) (all cell lines) and pan-Akt (L-363, MM.1s) or P-FOXO1/3A and P-GSK-3β (JJN-3). C) SGK3 knockdown does not substantially affect the survival of MM cells. Shown are the results of annexin V/PI staining followed by FACS analysis at day 4 post-electroporation. Relative survival rates are shown, i.e. survival (the annexin V/PI negative fraction) in stEGFP transfected control samples was always set as 100% and survival of the respective SGK3 knockdown samples is shown relative to their cognate controls. At least three independent experiments were performed for each cell line. Error bars denote s.e.m. D) Same experiments as described for C) but viability determined by alamarBlue colorimetric assay. E) Proliferation analysis (one of 2 similar experiments shown) performed on day 4 post-electroporation in MM cell lines treated with the stealth siRNA against EGFP versus stealth siRNA against SGK3. The percentages given above the lines denote the respective share of cells that have incorporated bromo-desoxyuridine (BrdU) during a 2 h BrdU pulse, indicating active DNA synthesis. F) Forward-scatter analysis of stEGFP versus stSGK3 treated cells at day 4 post-electroporation as a measure of cell volume. Top: examples for selection of the live cell fractions of stEGFP and stSGK3 transfected cells based on their forward versus sideward scatter location. Bottom: Distribution of the mean forward scatter values for between 4 and 5 independent experiments (i.e. different electroporations) per cell line. Horizontal black lines mark the mean value of the datapoints shown and vertical black lines indicate the s.e.m.

