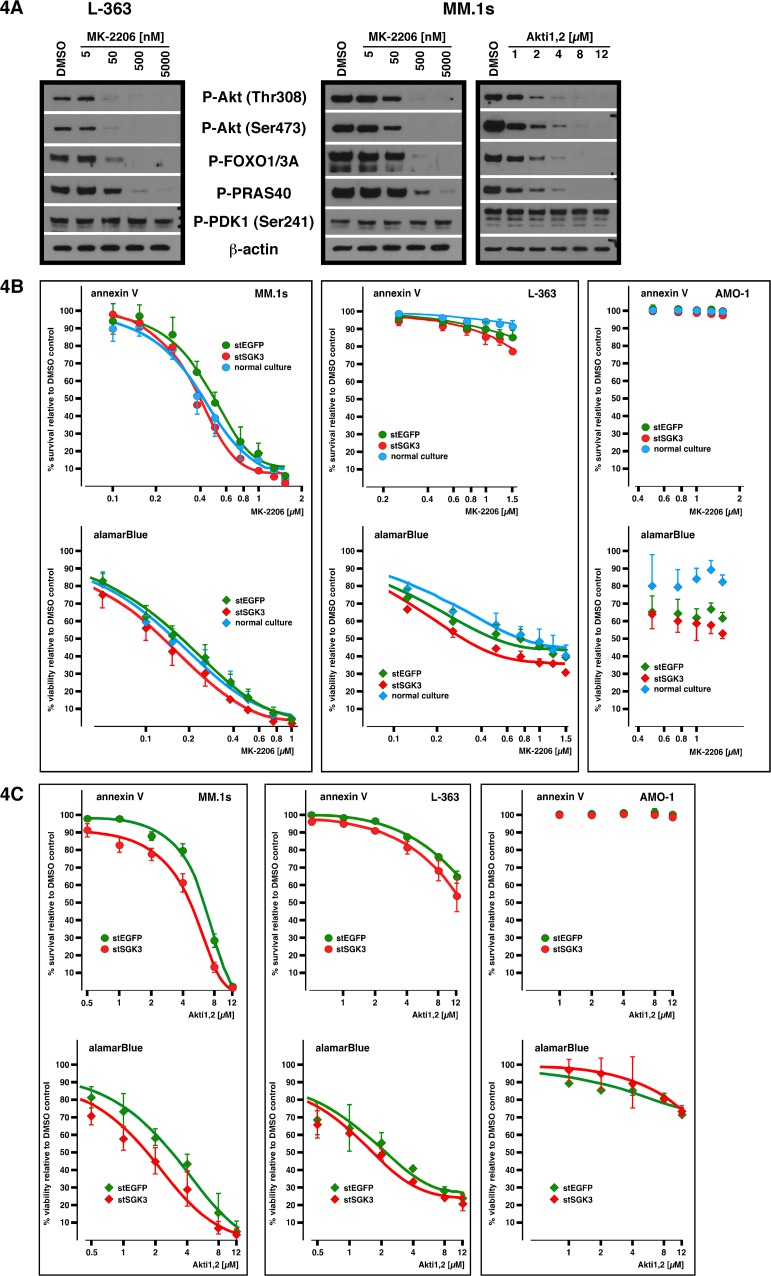
Fig 4. SGK3 knockdown in combination with Akt inhibition.
A) Titration of allosteric Akt inhibitors MK-2206 and Akti1,2. MM cells were incubated with the drugs for 30 min prior to harvest for Western blotting. B) Dose-effect curves representing cell death (annexin V) or viability (alamarBlue) assays for MM.1s cells (left), L-363 cells (middle) and AMO-1 cells (right) from either untreated cultures (blue dots), cells electroporated with stealth siRNA against EGFP (green dots) or cells electroporated with stealth siRNA against SGK3 (red dots), and treated with various concentrations of MK-2206 for 3 days. Drugs were added to electroporated cells at day 2 post-electroporation. Cells from untreated cultures were kept at similar densities as those of electroporated cells prior to drug addition. Each dose/effect curve is based on between 3 and 4 independent experiments. Error bars indicate s.e.m. C) Same experimental setup as described in B) but with Akt inhibitor Akti1,2. Each dose/effect curve is based on between 2 and 3 independent experiments. Error bars indicate s.e.m.

