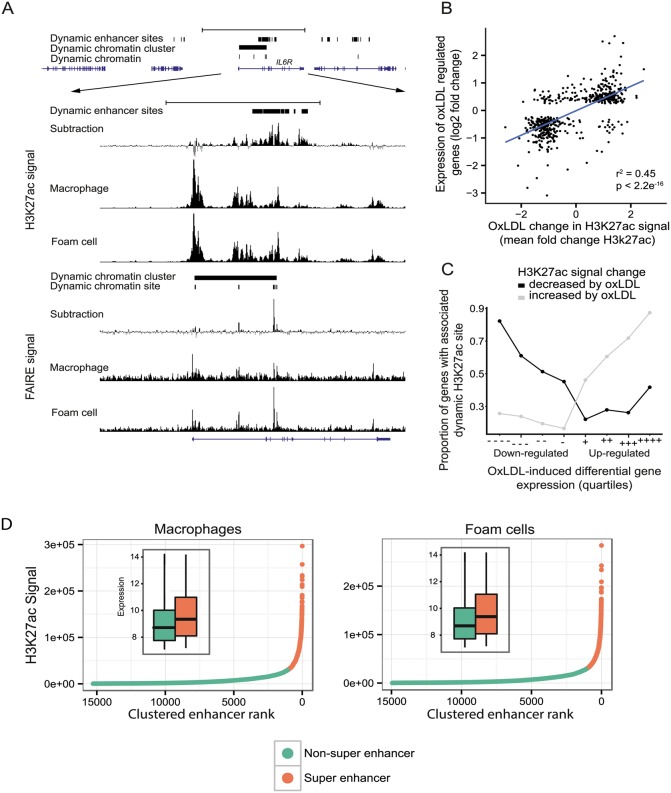
Fig 4. OxLDL-regulated dynamic enhancer signals correlate with expression changes in local genes.
(A) Open chromatin (FAIRE) and enhancer (H3K27ac) profile at the IL6R locus showing a dynamic chromatin cluster that overlaps a large, intronic dynamic enhancer site with increased signal in oxLDL-treated cells. (B) Correlation between fold change in gene expression for differentially expressed genes and mean fold change in enhancer signal for dynamic sites annotated to their nearest gene (r2 = 0.45, Pearson r = 0.67). (C) The proportion of the genes in each quartile that are associated with a dynamic enhancer site is plotted. Differentially expressed genes were split into oxLDL up and down regulated genes and further split into quartiles based on fold change in expression (-/+ and—-/++++ indicate least and most differential quartiles, respectively). The proportion of differentially expressed genes in each quartile that are associated with a directionally concordant change in a dynamic enhancer site is correlated with the magnitude of gene expression change. (D) Enhancers in macrophages or foam cells were aggregated if within 12.5kb and plotted according to H3k27ac signal rank. The insets show gene expression (log2, normalized) for genes overlapping either enhancers within super enhancer domains or other enhancers.

