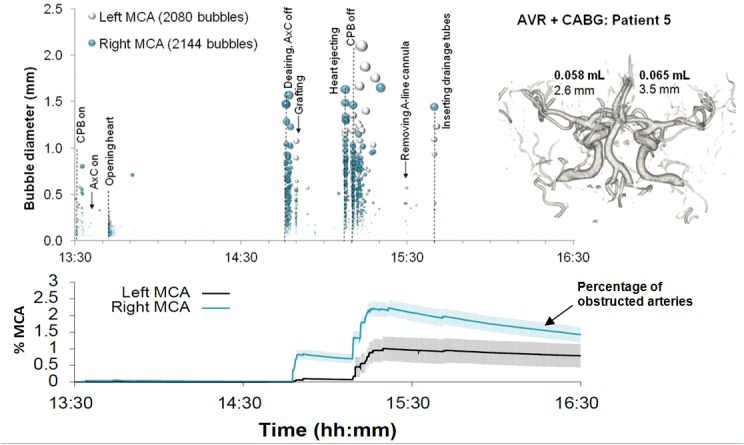
Fig 6. Timing and diameters of bubbles in a 55 year old patient during combined AVR and CABG.

Markers denote individual embolic events where the y-axis and marker size indicates estimated bubble diameter. The lower panel displays the predicted number of blocked end arterioles obtained by Monte-Carlo simulation. The shaded regions highlight 95% confidence intervals, based on uncertainty in bubble diameter and variations in outcome between simulations. The inset shows a 3D reconstruction of the circle of Willis labelled with estimated total volume of air and MCA diameters.
