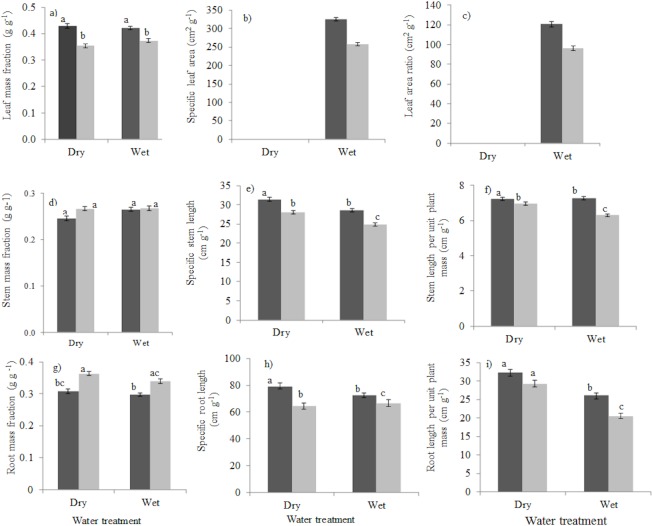
Fig 2. Seedling responses to drought and shade in terms of allocation (left panels), tissue morphology (middle panels) and whole-plant efficiency (right panels) for leaf- (top panels), stem- (middle panels) and root (lower panels) tissues.
Shade consisted of low light (5% of full sunlight, black bars) and high light (20% of full sunlight, grey bars). The drought treatment consisted of a wet treatment (plants continuously watered) and dry treatment (water was withheld from plants for nine weeks). (a) leaf mass fraction (LMF), (b) specific leaf area (SLA), (c) leaf area ratio (LAR), (d) stem mass fraction (SMF), (e) specific stem length (SSL), (f) stem length per unit plant mass (SLPM), (g) root mass fraction (RMF), (h) specific root length (SRL), and (i) root length per unit plant mass (RLPM). Means and standard errors are shown. Bars accompanied by a different letter are significantly different (ANCOVA, Turkey’s test P<0.05). n = 10 species. For droughted plants no bars are shown for SLA and LAR, because the leaves were desiccated, and their leaf area could not be measured precisely.

