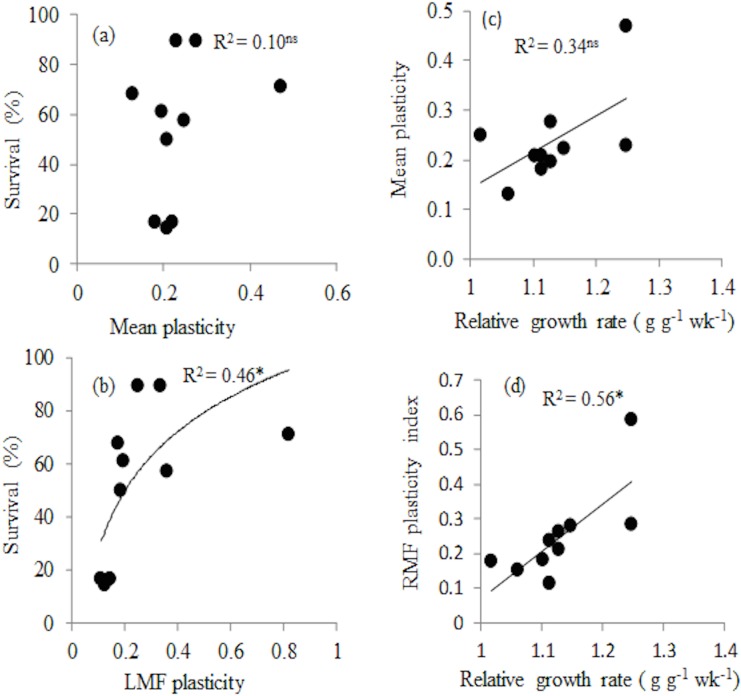
Fig 4. Relationship between survival under stressful conditions (drought and high light) and (a) mean plasticity of nine traits, (b) Leaf mass fraction (LMF) plasticity.
Relationship between relative growth rate under optimal conditions (continuous watering and 20% of full sunlight) and (c) mean plasticity and (d) root mass fraction plasticity. Plasticity for each trait was calculated as maximum minus minimum mean trait values divided by maximum mean trait values across four treatment combinations. For each species, mean plasticity was calculated as the average plasticity of 9 traits. Regression line and coefficient of determination are shown. Ns = not significant, * = p ≤ 0.05, ** = p ≤ 0.01, n = 10 species.

