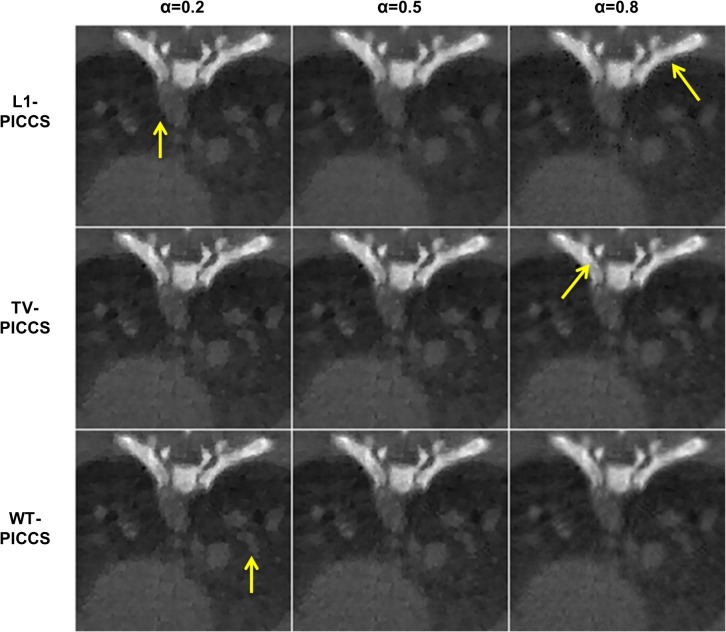
Fig 3. Zoomed-in images of the low-dose protocol data for respiratory phase one.
Reconstructions were performed with L1-PICCS, TV-PICCS, and WT-PICCS for α equal to 0.2, 0.5, and 0.8, for 120 projections and X-ray flux corresponding to a number of photons I 0 = 4.5∙104. Arrows point at locations where differences in texture are more noticeable.

