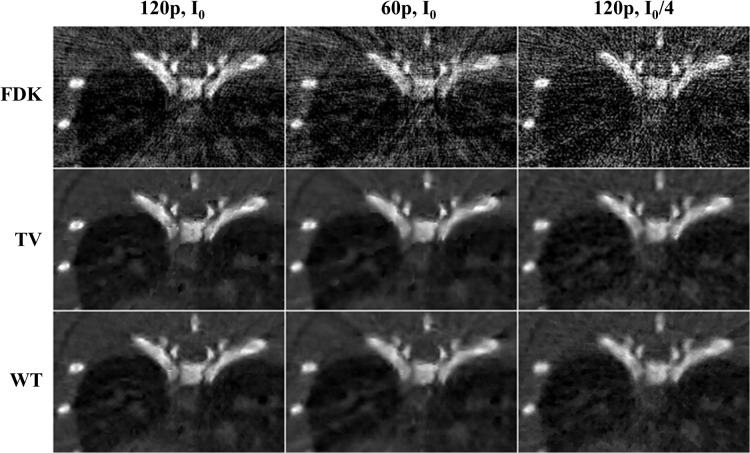
Fig 5. Zoomed-in images of low-dose protocol data for respiratory phase one, reconstructed with FDK, TV-PICCS, and WT-PICCS.
Columns represent the different scenarios: 120 projections and dose corresponding to a maximum number of photons I0 (I 0 = 4.5∙104), 60 projections and number of photons I 0, and 120 projections and number of photons I0/4 (from left to right). TV-PICCS and WT-PICCS were obtained with α = 0.8.

