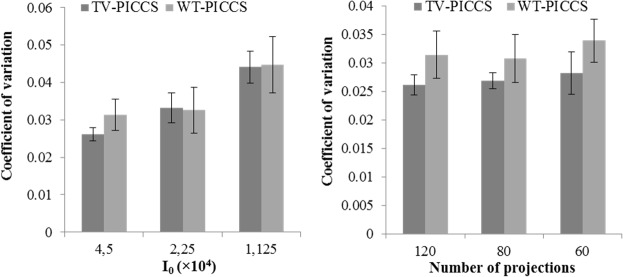
Fig 7. Coefficient of variation measured in images reconstructed with TV-PICCS and WT-PICCS for the different scenarios.

Plots show mean and standard deviation of the coefficient of variation measured in three different 312-pixel ROI inside soft-tissues. Left panel shows different X-ray flux values for 120 projections; right panel represents different number of projections for a flux corresponding to a number of photons I 0 = 4.5∙104.
