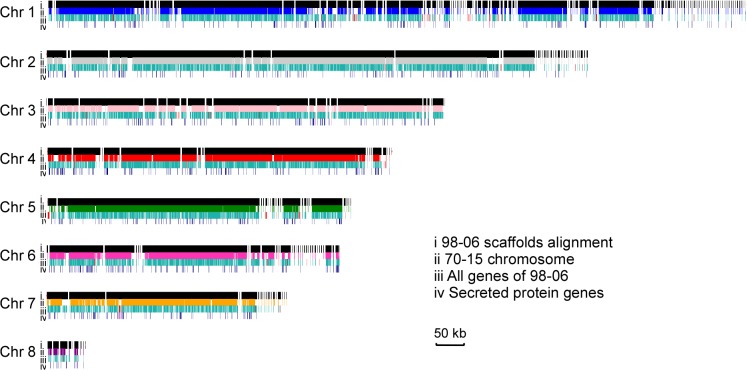
Fig 1. Global view of synteny alignments between isolates 98–06 and 70–15.
Scaffolds, genes, and secreted protein genes distribution in isolate 98–06 compared to 70–15. For each chromosome, the first line (i) represents the genomic scaffolds of 98–06 alignment with 70–15; the second line (ii) displays the chromosmes of 70–15; the third line (iii) and fourth line (iv) show all genes and secreted protein genes, respectively. The red small vertical lines in line (iii) and line (iv) show the isolate-specific genes in 98–06 compared to 70–15. Chr, chromosome.

