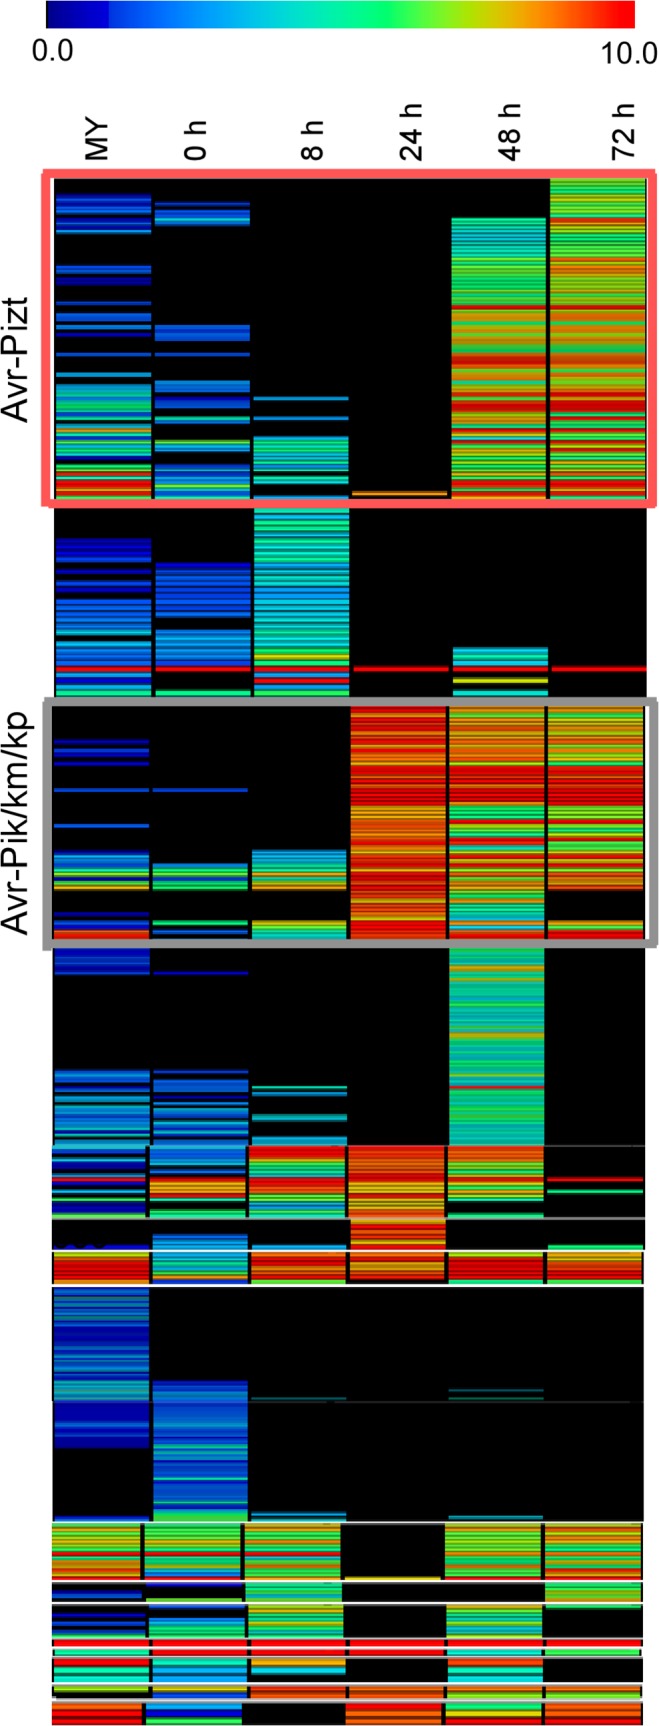
Fig 4. Heat map of 645 small candidate effectors of 98–06.

645 candidate effectors were added to employ the hierarchical clustering, and divided into two groups (red rectangle and gray rectangle) according to the expression pattern of Avr-Pik and AvrPiz-t, providing 134 candidate effectors. The color bar represents the log2 of (RPKM +1) value, ranging from blue (0.0) to red (10.0).
