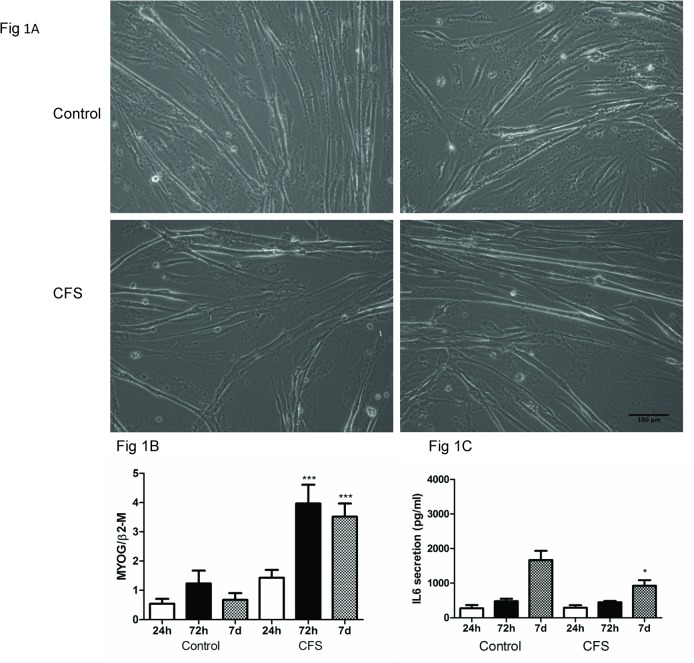
Fig 1. Analysis of the differentiation capacity of control vs CFS cultures.
Representative light microscope images of 2 control (top panels) and 2 CFS (bottom panels) cultures taken 7 days after initiation of differentiation. Images were taken at a 10x magnification (A). MYOG expression at 24h, 72h and 7 days after initiation of differentiation from control and CFS cultures was measured by QPCR (B). Data were normalised to the reference gene, β2-microglobulin and are presented as the mean±SEM from 5 controls and 8 CFS subjects analysed in triplicate. ***p<0.0001. IL6 release into the media was measured at 24h, 72h and 7 days after initiation of differentiation from control and CFS cultures by ELISA (C). Data are expressed as the mean±SEM from 5 controls and 8 CFS subjects in duplicate. *p<0.05.

