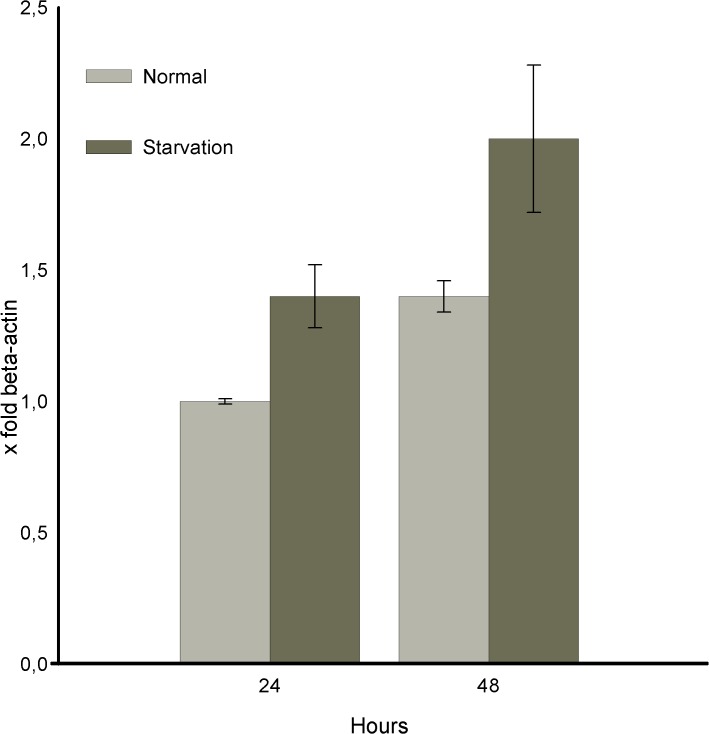
Fig 2. Tβ4 mRNA expression detected by RT-PCR reaction in HepG2 cells growing in normal serum and in starvation conditions.
The ratio value Tβ4/β actin detected at 24h in normal condition was assumed as equal to 1 (calibrator sample). In these conditions the Tβ4 expression patterns suggest a moderate Tβ4 mRNA increase expression rate from 24 to 48h in normal conditions and, a more high Tβ4 mRNA expression values, during starvation.(2 folds in difference at 48h). The vertical bars, reppresent the range of standard error (+-SE) of the mean.

