
Fig 3. Small intestinal lesion development in A/J Min/+ mice fed four different diets; (△) Control; (●) Hemin; (◇) Hemin+Nitrite; (■) Nitrite.
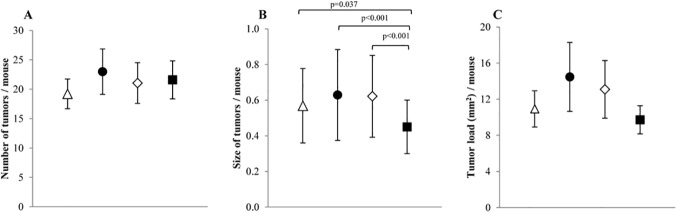
A) number of tumors, B) tumor size, and C) tumor load in the small intestine. Values represent the mean, error bars show the 95% confidence interval. Horizontal bars indicate significant difference between the groups.