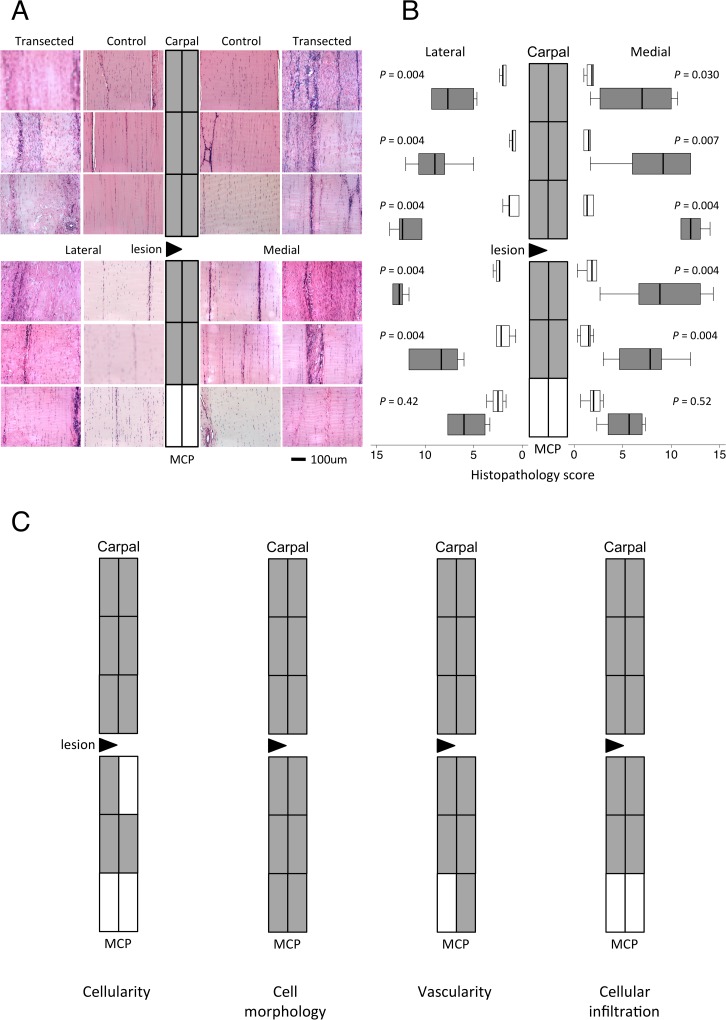
Fig 2. Tendon histopathology.
Representative light microscopic images of haematoxylin and eosin-stained sections (A) from each location from a control and transected SDFT mapped to a diagram of the SDFT as depicted in Fig 1A. (B) Topographically-mapped box plot of overall histopathology scores ((n = 6 per group and region) of partially transected tendons (dark bars) compared with control SDFT (light bars). The lateral lesion site in the transected tendons is indicated by a triangle. As the horizontal scale indicates, expression on lateral side increases from right to left for display symmetry. Tendon regions in the central diagram are shaded if the score difference between control and transected tendons (indicated P values) is significant at the 5% level by Mann-Whitney U. Overall histopathology scores were higher in regions near the site of transection compared to regions further away in the partially transected tendons (P < 0.009, Kruskal-Wallis analyses). There were no significant differences in histological parameters between medial and lateral halves of the tendons. Lines within the boxes represent the median, the boxes represent the 25th and 75th percentiles, and the lines outside the boxes correspond to the minimum and maximum values. C) Topographical maps of significant changes in the indicated histopathology scores. Full box plots for these scores are in S2 Fig.

