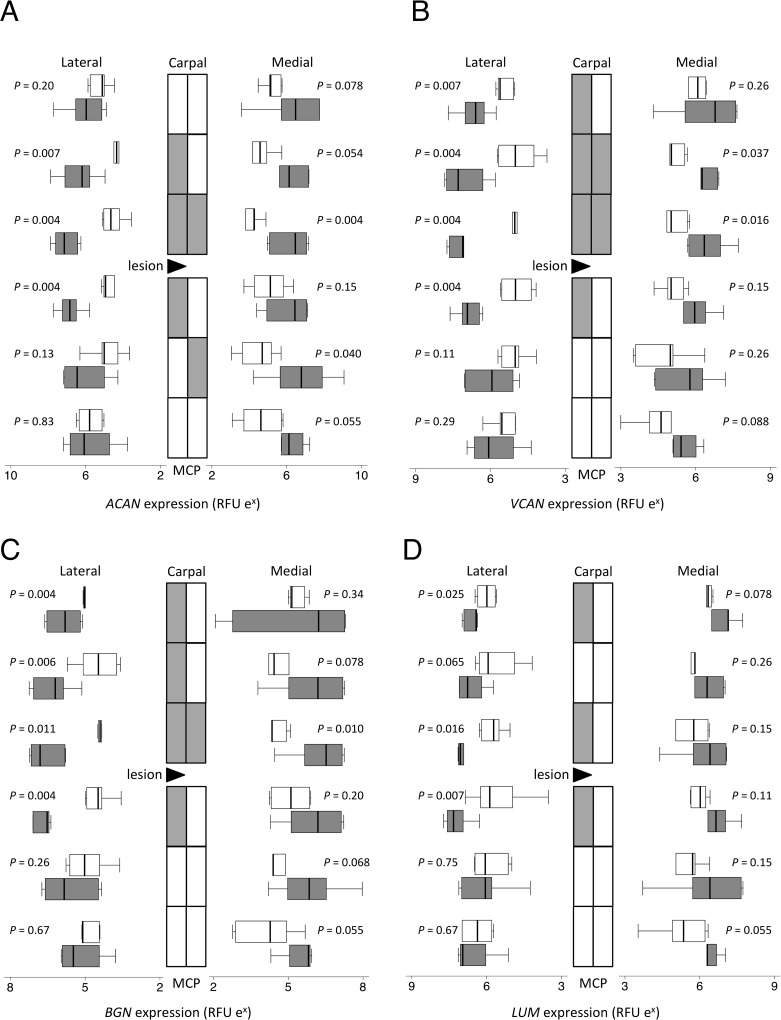
Fig 4. Proteoglycan gene expression.
Topographically-mapped box plots (n = 6 per group and region) of (A) aggrecan, (B) versican, (C) biglycan and (D) lumican gene expression by partially transected tendons (dark bars) compared with control SDFT (light bars). The lateral lesion site in the transected tendons is indicated by the black triangle. As the horizontal logarithmic scale indicates, expression on lateral side increases from right to left for display symmetry. Tendon regions in the central diagram are shaded if the score difference between control and transected tendons (indicated P values) is significant at the 5% level by Mann-Whitney U. RFU = relative fluorescent units. Differences in expression between different locations as assessed by mixed model regression are summarized in Table 2.

