Figure 5.
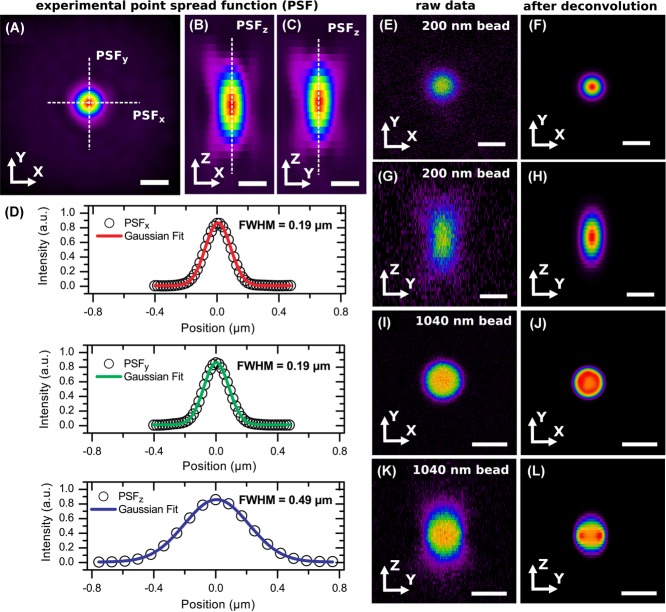
Experimental measurement of the point spread function (PSF) and imaging of single fluorescent beads. Images were recorded with a 100x/1.4 oil immersion objective. (A) The PSF in the XY plane. Intensity profiles were recorded along the indicated cross-sections. (B–C) The PSF in the z-direction clearly shows the expected elongation, due to the more limited resolution in the axial direction. The scale bars in (A-C) are 300 nm. (D) Recorded intensity profiles from the images in (A) and (B). The FWHMs that we obtained were 190 nm in the lateral and 490 nm in the axial direction. (E–H) Orthogonal views of a polystyrene bead with a diameter of 200 nm, before and after deconvolution. The scale bar is 300 nm. (I–L) Orthogonal views of a PMMA sphere with diameter 1040 nm, again before and after deconvolution. The scale bar is 1 μm.

