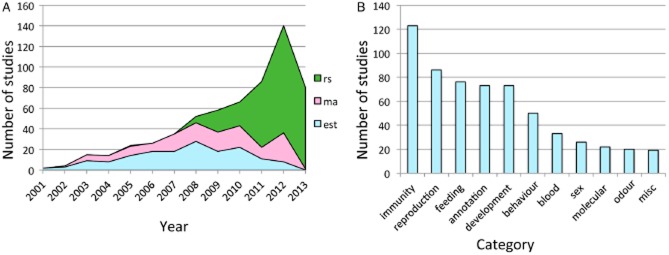
Figure 2.

(A) Compilation of studies using transcriptomics in non-model (i.e. non Droosophila melanogaster) insects. The graph is a cumulative count of number of insect transcriptomes analyzed by year since 2001. Blue indicates clone and sequence expressed sequence tag studies, red indicates microarray studies and green inidicates the number of RNA-Seq studies done with next generation sequencing. (B) Bar graph showing the number of insect transcriptomes analyzed and the category of research the transcriptome was generated for.
