
Figure 1.
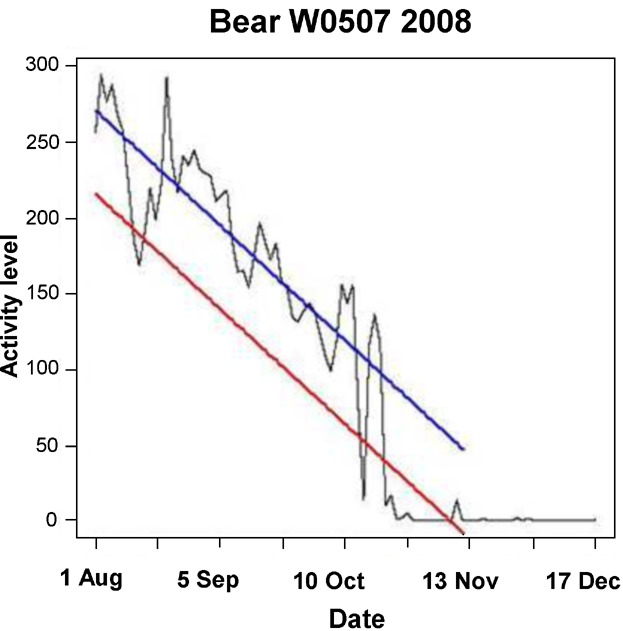
Example of pre-denning activity analysis on an individual Scandinavian brown bear in south-central Sweden in 2008. The blue line shows the bear-specific linear model of normal behavior data, and the red line is the lower control limit (LCL). We defined the start of predenning activity as the first time the activity value dropped below and remained under the LCL (20 Oct in this example). The observed 5-minute activity (black line) clearly shows the gradual reduction in activity, the variation in activity, and hibernation activity levels.