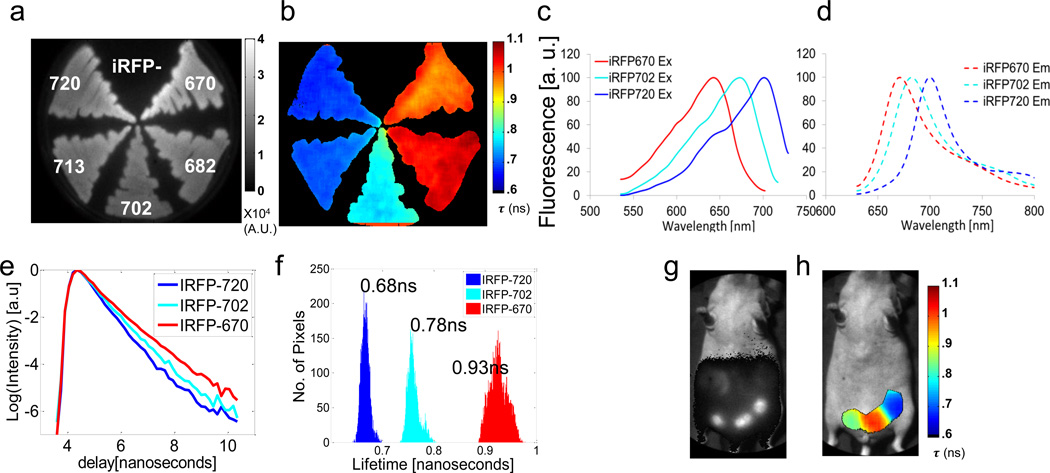
Figure 1. In vitro and in vivo lifetime multiplexing of iRFPs.
All fluorescence data was acquired with single excitation/emission filter pair: ex: 650/40 nm, em: 700 nm long pass. (a) Continuous wave and (b) fluorescence lifetime images of bacteria expressing five iRFP variants (iRFP670, 682, 702, 713 and 720). (c) Normalized excitation and (d) emission spectra of iRFP670, 702 and 720. (e) TD fluorescence signal of iRFP670, 702 and 720 in bacteria. (f) Histogram of lifetime distribution derived from fluorescence lifetime image in (b). (g) Continuous wave and (h) fluorescence lifetime image of three MTLn3 tumors expressing iRFP670, 702 and 720 in the mammary fat pad of a female nude mouse.

