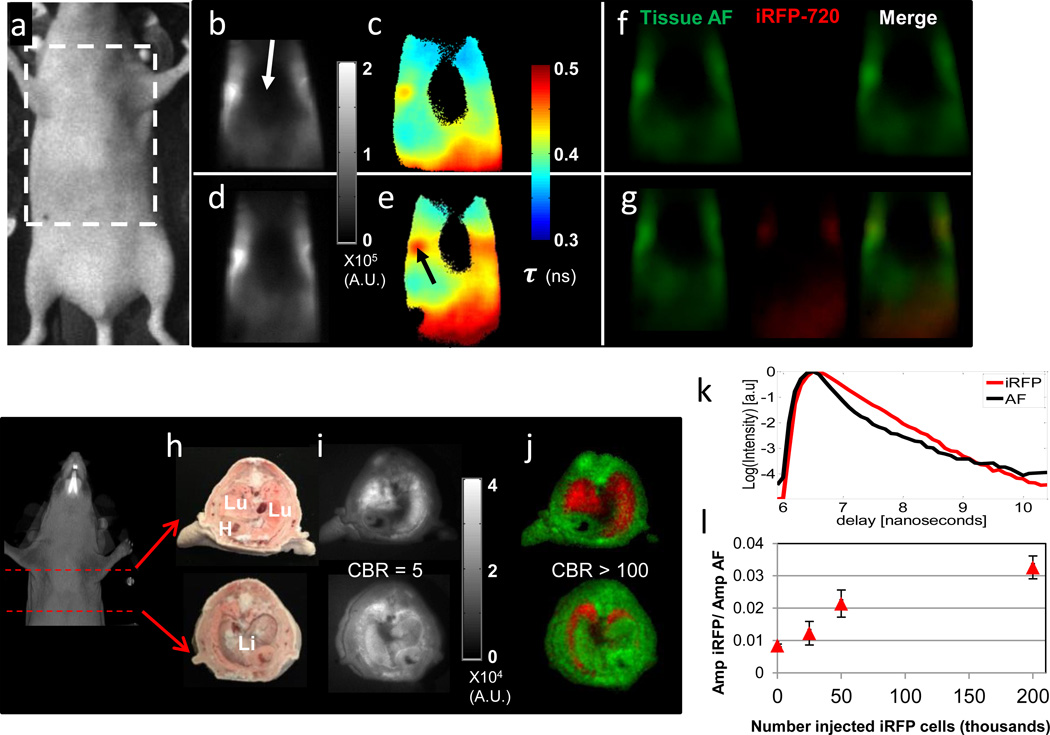
Figure 2. In vivo and ex vivo planar lifetime imaging of iRFP720 labelled cells in the lungs.
(a) Snapshot and imaging region of interest. Transmission fluorescence images before (b, c, f) and after (d,e,g) i.v. injection of 2.0 ×10⁶ MTLn3-iRFP720 cells. (b, d) CW fluorescence, (c, e) fluorescence lifetime images obtained from single exponential fits at each pixel and (f, g) fluorescence decay amplitudes of tissue AF (green) and iRFP720 (red) obtained from a dual basis function analysis (Eq. (1)) of transmission TD fluorescence measurements, shown separately and as a merged RGB image. (h) White light, Lu= lungs, Li=liver, H=heart, (i) CW fluorescence, and (j) Dual fluorescence decay amplitude images of cryosections from the thorax of a mouse following i.v. injection of 2.0×10⁶ MTLn3-iRFP720 cells, showing AF (green) and iRFP720 (red) decay amplitudes as a single composite RGB image. (k) Representative TD fluorescence profiles of mouse tissue AF (black line) and iRFP720 (red line) from the cryosection measurements. (l) Ratio of iRFP720 to tissue AF fluorescence decay amplitude obtained from a dual basis function analysis of planar TD transmission fluorescence images of mice that received serial dilutions of MTLn3-iRFP720 cells via the tail vein.

