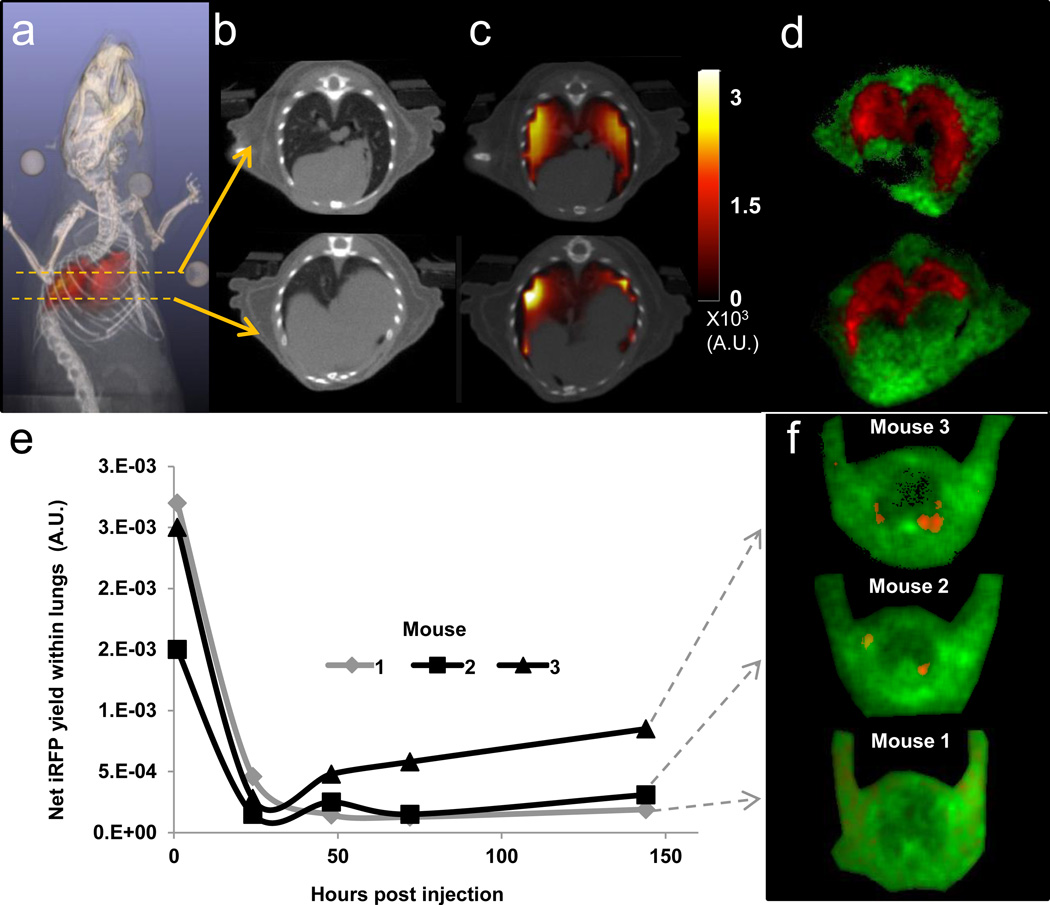
Figure 3. Tomography and longitudinal imaging iRFP720 cancer cells from the lungs.
(a) Reconstructed in vivo fluorescence yield distribution (red) immediately following the injection of 2×10⁶ MTLn3-iRFP720 cells in the tail vein of a nude mouse, co-registered with X-ray CT (grayscale) (See also Supplementary Video 1). Coronal slice of (b) the CT and (c) the ATD reconstruction of iRFP720 yield co-registered with CT. (d) Decay amplitude images obtained from dual basis function analysis (Eq. (1)) of reflectance TD images of lung cryosections of the same mouse shown in (a–c). AF (green) and iRFP720 (red) amplitudes are shown as a single RGB image. (e) Longitudinal study to monitor MTLn3 fate in three live nude mice following tail vein injection of 1×10⁶ MTLn3-iRFP720 cells. Tomographic measurements were made from the injection time point up to 144 hours post injection. Net iRFP720 fluorescence yield within the lungs of the three mice, reconstructed using the ATD approach. (f) Decay amplitude images of lung cryoslices from the three mice in (e) following sacrifice at 144 hours post injection, showing AF (green) and iRFP720 (red).

