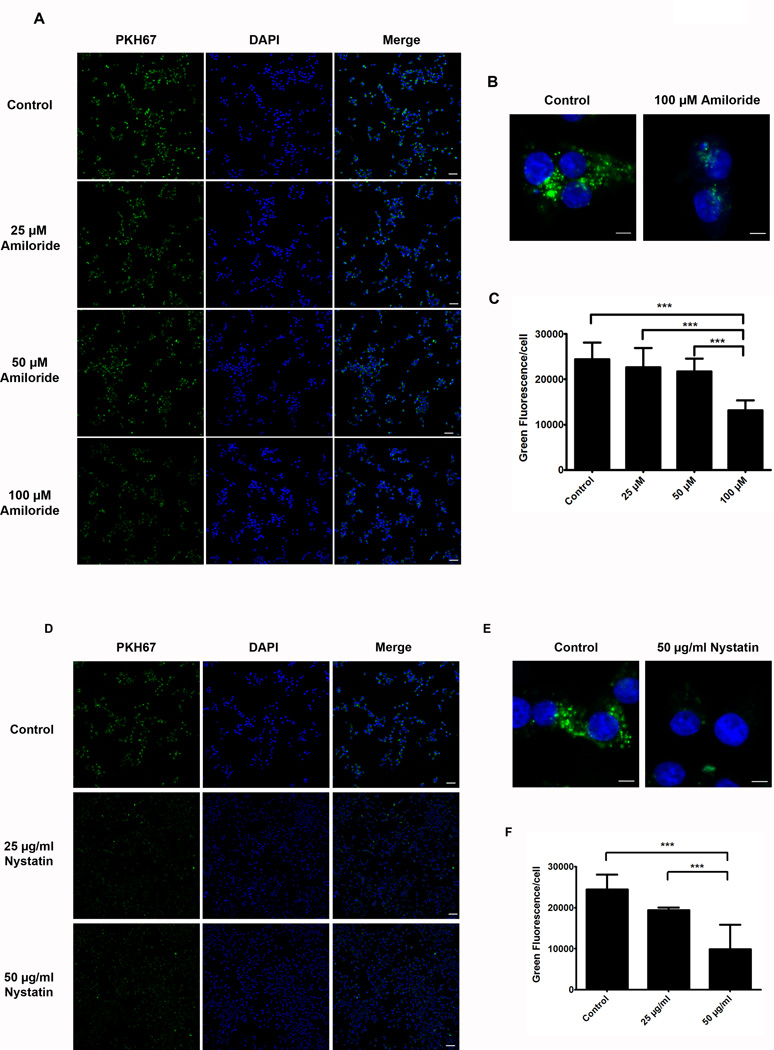
Figure 4. Pharmacological inhibition of the endocytic pathway blocks exosome uptake into INS-1 cells.
(A) INS-1 cells were treated with varying concentrations of Amiloride (25, 50, and 100 µM) for 15 minutes. PANC-1 exosomes were dyed with PKH67 and incubated with the cells after Amiloride treatment for 5 hours to allow exosome uptake. Scale bars represent 10 µm. (B) Zoom images (10.5X) of exosome internalization into INS-1 cells in the presence or absence of 100 µM Amiloride. Scale bar represents 5 µm. (C) Quantification of green fluorescence/cell in all treatment groups. (D) INS-1 cells were treated with 25 µg/ml or 50 µg/ml Nystatin for 30 minutes. PKH67-dyed exosomes were incubated with the cells for 5 hours to allow internalization. Scale bars represent 10 µm. (E) Zoom images (10.5X) of cells treated with 50 µg/ml Nystatin compared to control (untreated) cells show decreased PKH67-dyed exosome internalization. Scale bar represents 5 µm. (F) Green fluorescence quantification of internalized exosomes in the presence of absence of Nystatin. ***, P<.0001.

