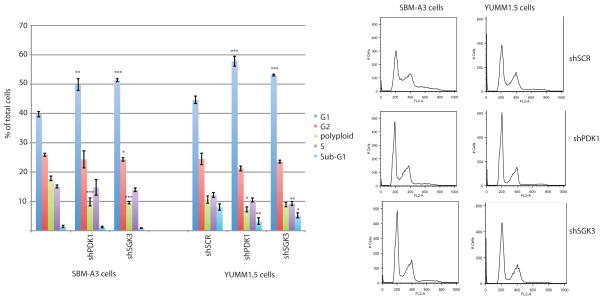
Figure 4. Inhibition of PDK1 or SGK3 induces cell cycle arrest in G1.
Cell cycle distribution of SBM-A3 and YUMM1.5 cells stably expressing control shRNA (shSCR) or Pdk1- or Sgk3-targeted shRNAs. Left: Percentage of cells in the indicated cell cycle phases. Values are the mean ± SEM of biological triplicates. Right: Representative FACS profiles of the DNA content (propidium iodide staining) of cells expressing the indicated shRNAs. targeted*P < 0.05, **P < 0.001, ***P < 0.0001.

