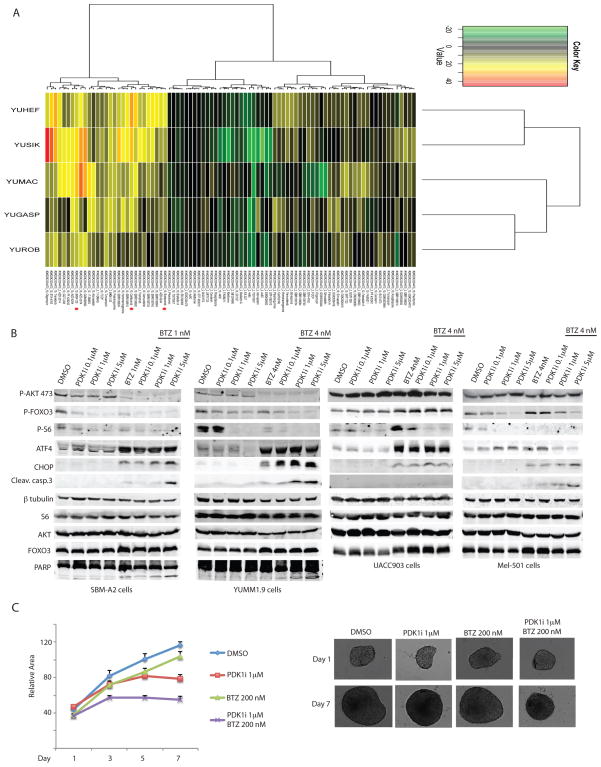
Figure 5. Combination screen of PDK1i against 45 candidate test agents.
(A) Heat map of model-free area under the curve (AUC) of GSK2334470 at each of the two concentrations tested with unsupervised clustering of test agents (rows) and cell lines (columns). Red dots mark Bortezomib, Carfilzomib, and BKM-120 combinations with 10 μM GSK2334470. Dilutions of test agents were combined with either 0.1% DMSO vehicle, 2 μM GSK2334470, or 10 μM GSK2334470 and incubated with cell lines and assayed after 3 days with CellTiterGlo as described in Methods. Cell lines tested were YUROB, YUHEF (WT BRAF,NRAS), YUMAC, YUSIK (BRAF), YUGASP (NRAS). (B) Western blot analysis of the indicated proteins in mouse melanoma cells SBM-A2 and YUMM1.9, and human melanoma cell lines UACC903 and Mel501 treated for 24 h with 0.1, 1, or 5 μM of GSK2334470 (PDK1i) in the presence or absence of the proteasome inhibitor bortezomib (BTZ) at 1 nM (SBM-A2) or 4 nM (YUMM1.9, UACC903, Mel501). (C) Growth of YUMM1.5 spheroids treated with the indicated concentrations of GSK2334470 (PDK1i) and BTZ alone or in combination. Relative areas were calculated as described for Figure 2. Values are the mean ± SEM of ≥6 spheroids per group.

