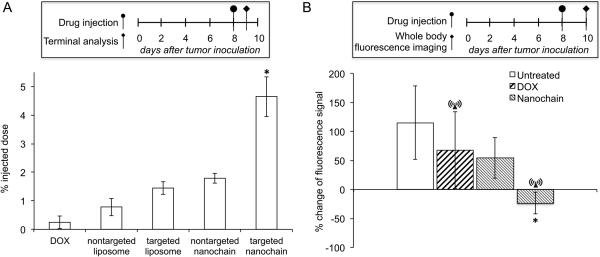
Fig. 3.
Evaluation of the ability of nanochains to target invasive brain tumors in mice. A, CNS-1 cells (2×10⁵) were implanted in the right striatum at a depth of 3 mm from dura. At 8 days after tumor inoculation, the animals were injected with DOX, non-targeted liposomes, integrin-targeting liposomes, non-targeted nanochains and targeted nanochains. All formulations were administered at a dose 0.5 mg DOX per kg of body weight (n=4 mice per group; * P<0.01 by Student’s t-test). At 24 h after injection, animals were euthanized, brain tumors were excised and their DOX content was extracted and measured using an established method. B, as a metric of the response of brain tumors to various treatments (n=5 in each group), quantification of fluorescence intensity (FI) was used. The stable expression of green fluorescence protein within the CNS-1 cells enabled in vivo imaging using a CRi Maestro fluorescence imaging system. All formulations were administered at day 8 after tumor inoculation at a dose of 0.5 mg DOX per kg b.w. In the case of treatments combined with the RF field, animals were exposed for 60 min to an RF field (amplitude B=5 mT, frequency f=10 kHz) using a custom-made solenoid coil. The y-axis represents the normalized difference of fluorescence signal between days 8 and 10 (calculation of normalized value [(FIday8- FIday10)/FIday8]x100; n=5 in each group; * P<0.01 by Student’s t-test)

