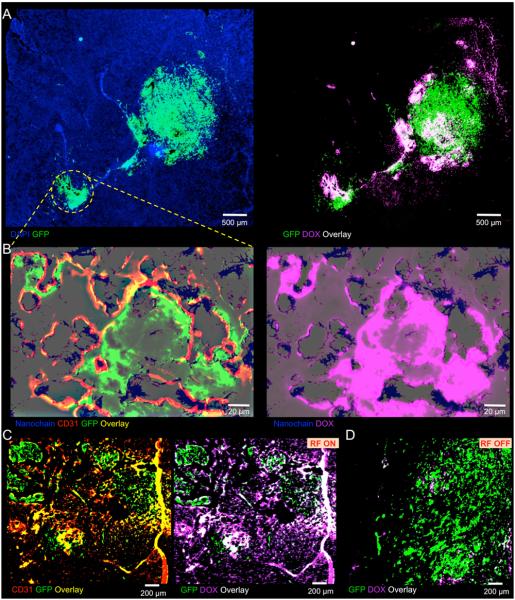
Fig. 4.
Histological evaluation of the nanochain treatment. A, histological evaluation of the anticancer effect of nanochains was performed in the orthotopic CNS-1 model in mice (5x magnification; green: CNS-1 glioma cells (GFP); blue: nuclear stain (DAPI); violet: DOX). Fluorescence imaging of an entire histological section of the brain shows the primary tumor and its invasive sites (left panel). Fluorescence imaging of the same histological section shows the widespread distribution of DOX molecules after a 60-min application of RF (right panel). B, higher magnification imaging (20x) of an invasive site shows the location of nanochains (blue) with respect to the location of endothelial cells (green: CD 31) and brain tumor cells (left panel), and the RF-triggered release of DOX (right panel) in the same histological section. Nanochains were visualized by staining iron with Prussian blue. The distribution of DOX molecules is shown with (C) or without RF (D) with respect to the location of cancer cells.

