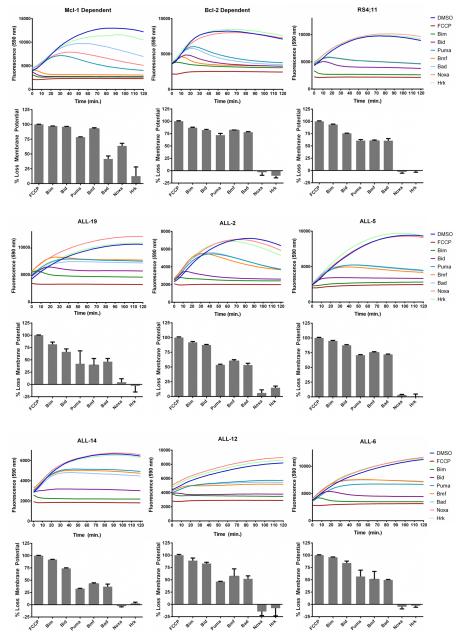
Fig. 2. Primary ALL cells are Bcl-2-dependent.
Mcl-1-dependent or Bcl-2-dependent leukemia cell lines, RS4;11 cells, or primary ALL cultures, as indicated, were subjected to whole cell BH3 profiling with JC-1 dye, as described in Materials and Methods. The traces shown in the top of each panel represent an average of triplicates, and are color coded according to the key on the right of each set. The bar graphs in the lower portion of each panel represent mean ± s.d. (n = 3), normalized to that of FCCP (100% loss of mitochondrial membrane potential) and are derived from readings obtained at 120 min. Note that Noxa and Hrk peptides sometimes gave fluorescence readings (top panels) that were slightly greater than DMSO control, and these appear as small negative values in the bar graph representation in the lower panels.

