Figure 1.

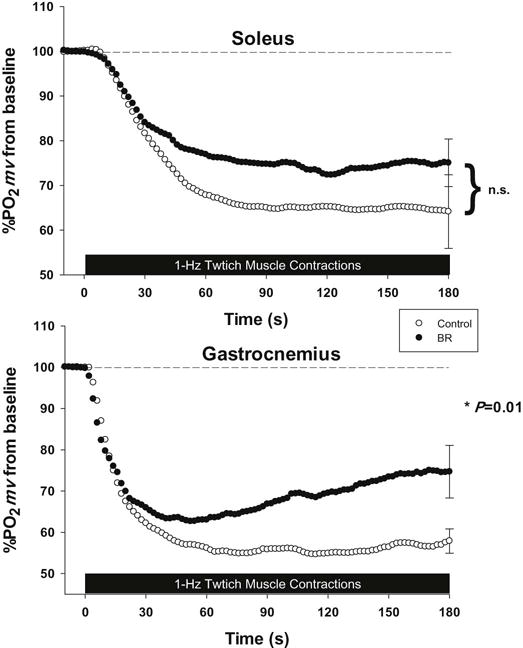
Mean percent delta PO2mv profiles for the soleus (top panel) and MG (bottom panel) muscles of control and BR rats. Time “0” represents the onset of contractions. *P<0.05 versus control.

Mean percent delta PO2mv profiles for the soleus (top panel) and MG (bottom panel) muscles of control and BR rats. Time “0” represents the onset of contractions. *P<0.05 versus control.