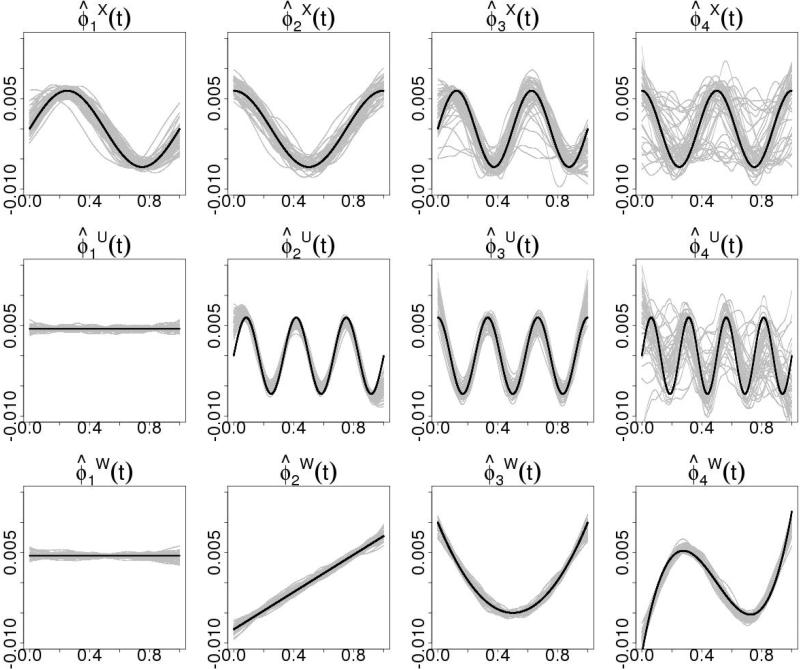
Figure 3.
The estimated eigenfunctions for three latent processes over 100 simulations when σ 0.5 are shown in gray (we randomly plot 50 out of 100 estimates). The true eigenfunctions are displayed in black curves.=The first- and second-level hierarchies X and U are captured by two sets of trigonometric basis. The third-level process W is polynomial. Within each process, the first few eigenfunctions in correspondence with larger percentages of variance explanation are better estimated than the later eigenfunctions. The eigenfunctions for W are better estimated than X and U because we observe more levels of independent realizations for W.

