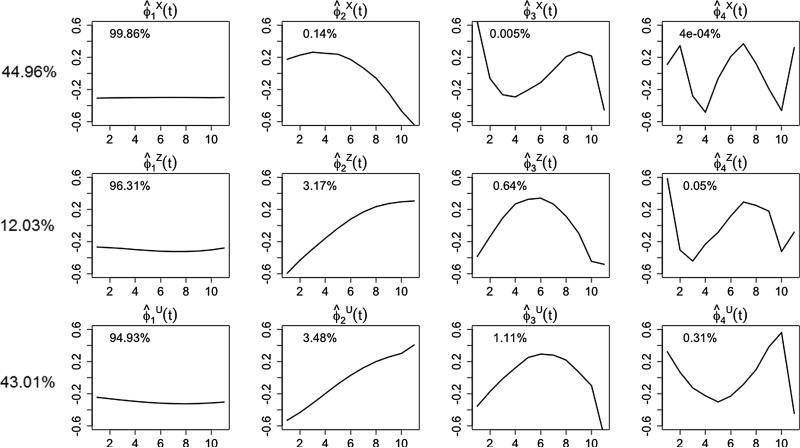
Figure 4.
Principal components for process Xi(t), Zj(t), and Uijk(t) using two-way crossed model with sub-sampling (C2s) to analyze the phonetic data. The top row show the first four PCs for the speaker-specific effect Xi(t), while the second row display PCs for word effect Zj(t). The proportion of variation explained by every principal component within each latent process is listed inside the plotting window. The estimated percentages of total variation explained by the latent processes are shown in front of the rows.

