Fig. 7.
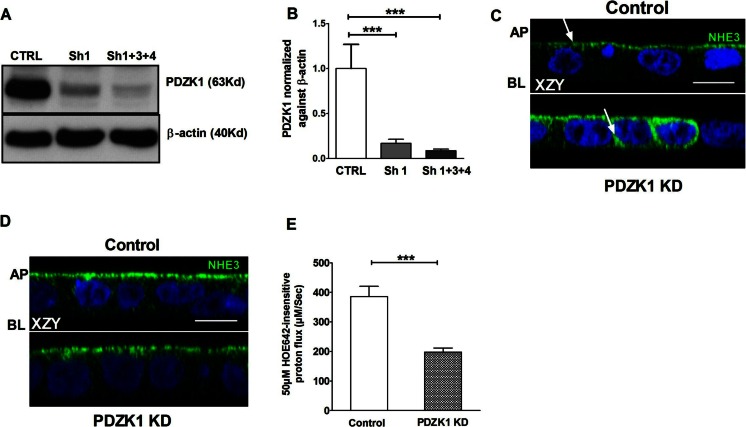
PDZK1 knockdown (PDZK1 KD) was established in Caco-2BBe/hNHE3V (C2N3) cells. PDZK1 KD cells display significantly reduced acid-activated NHE3 activity compared to control cells. a Total cell lysates from C2N3 cells infected with empty vector lentivirus (control/CTRL) and PDZK1 shRNAs (Sh1 and Sh1 + 3 + 4) were analyzed by Western blots. b Protein bands were quantified using image J software and the values were normalized against β-actin, n = 3. c Immunofluorescence images obtained by confocal microscopy in XZY plane showed a more diffused expression of NHE3-VSV-G in the cytoplasm of PDZK1 KD cells compared to control cells (arrow pointing to NHE3 staining); AP apical membrane, BL basolateral membrane. ***P < 0.0005. d Acid suicide was applied to improve the homogeneity and expression of NHE3 in both control and PDZK1 KD cells, after which a similar pattern of NHE3 expression was obtained in both control and PDZK1 KD cells. Those cells were then used for the NHE3 activity measurements. Scale bar represents 10 μM. e NHE3 activity was measured fluorometrically in C2N3/PDZK1 KD cells, which showed a significant reduction in NHE3 activity compared to control cells. Bar graph represents the results from three to five different passages and includes a total of at least nine cover slips (five regions of interest assessed in each cover slip) for each condition. Bar graphs are represented as mean ± SEM. ***P < 0.0005 compared to controls

