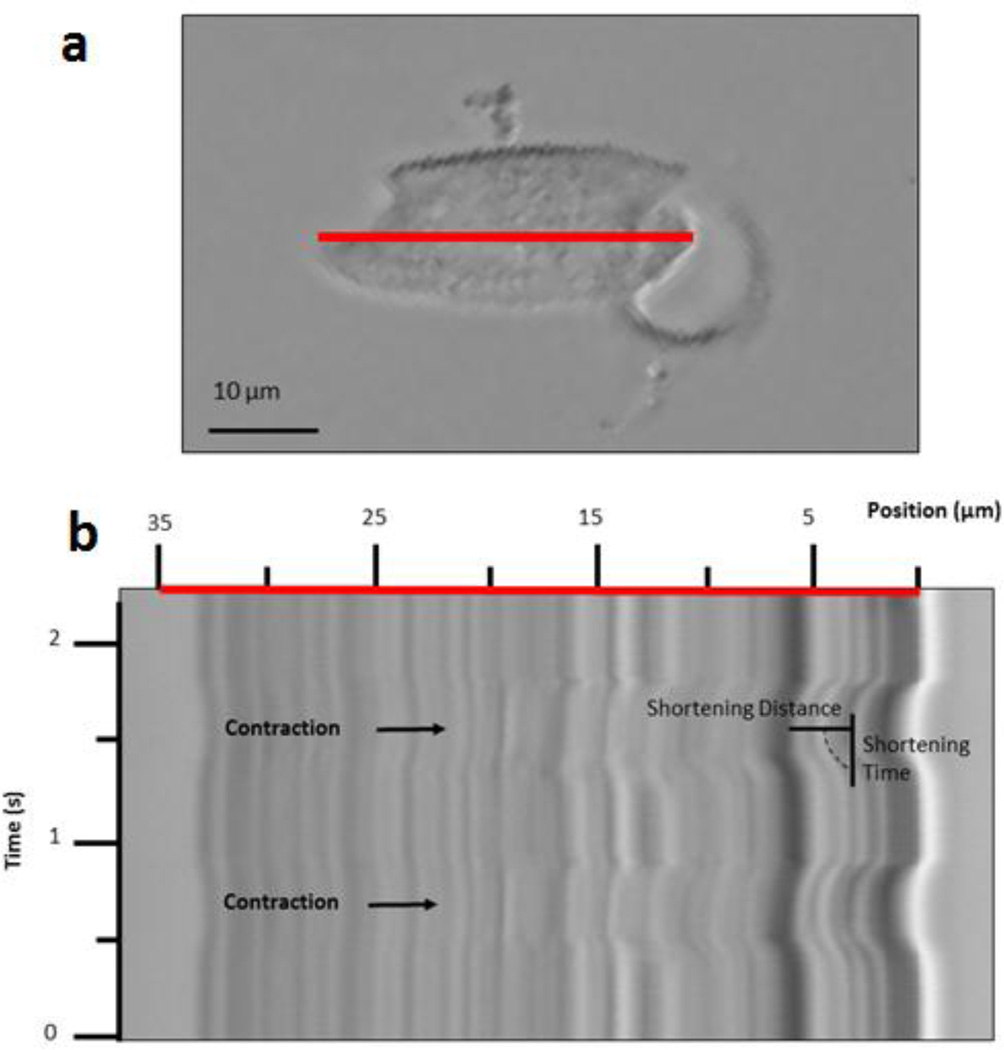
Figure 2. Measuring Shortening and Shortening Velocity using a Kymograph.
(a) Motion recorded within a single NRVM on a 100 kPa Post, 1 day after plating, via a line scan (red line). (b) Kymograph of axial cell displacements (red line scanned over time) yields maximum shortening, at which maximum shortening time is measured.

