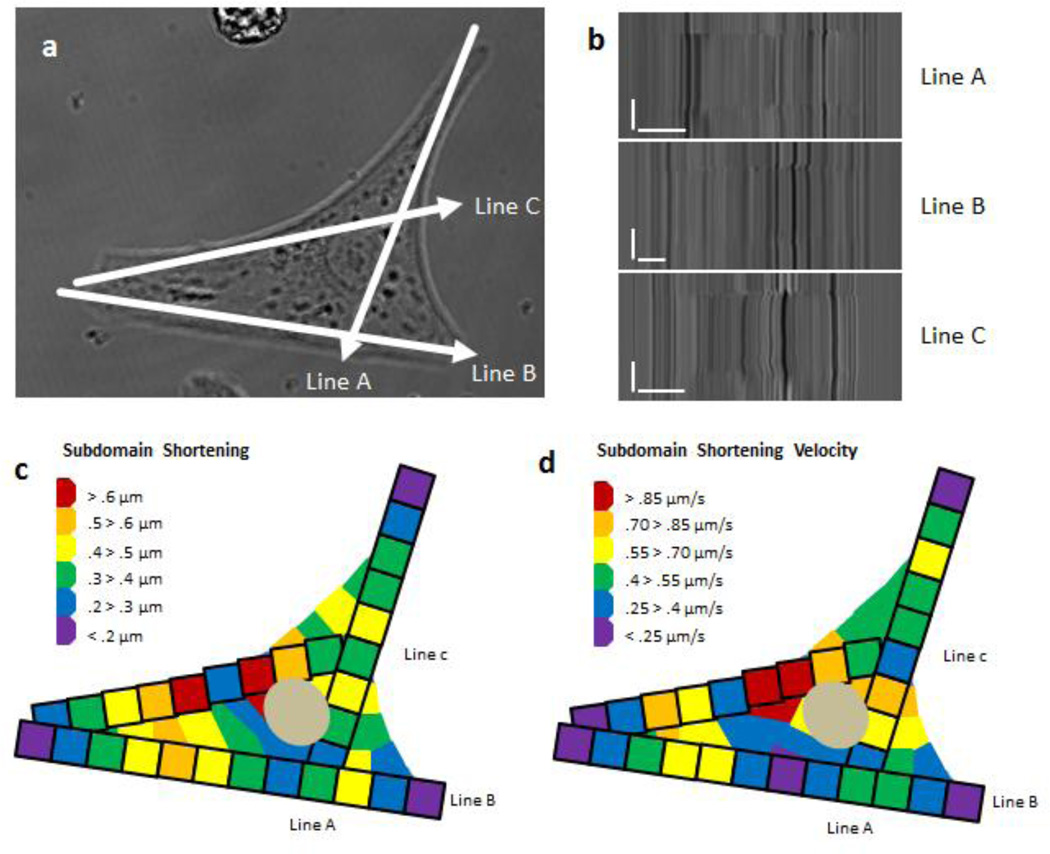
Figure 6. Subdomain Shortening and Shortening Velocity within the Cardiomyocyte.
(a) Three different myofibrils were scanned using line scan microscopy within a single cardiomyocyte plated on a 400 kPa flat substrate. (b) Raw data of each myofibril line scan was then analyzed in five micron increments to determine shortening and shortening velocity within the subdomains of the cardiomyocyte. (c, d) Subdomain shortening at each position was then transposed as a 5 × 5 micron square as depicted with a black outline box per each subdomain; the remaining cell region is interpreted to have shortening and shortening velocity similar to the adjacent subdomain. (B) Scale Bars: Distance = 10 microns; Time = 1 second.

