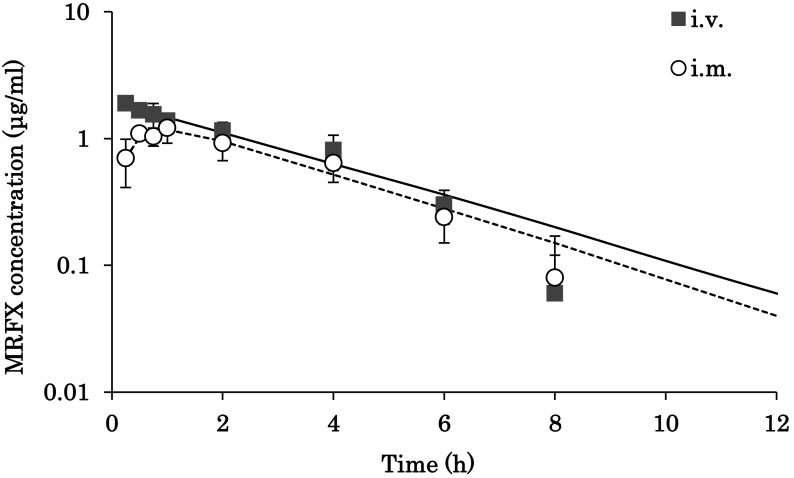
Fig. 1.
Semi-logarithmic plot of serum concentration (mean ± SD) versus time after single intravenous (i.v.) and intramuscular (i.m.) administration of marbofloxacin (2 mg/kg) in Hanwoo cow (n=6). The markers (full squares and empty circles) represent the observed points, and the lines (solid and dashed) represent the predicted values.

