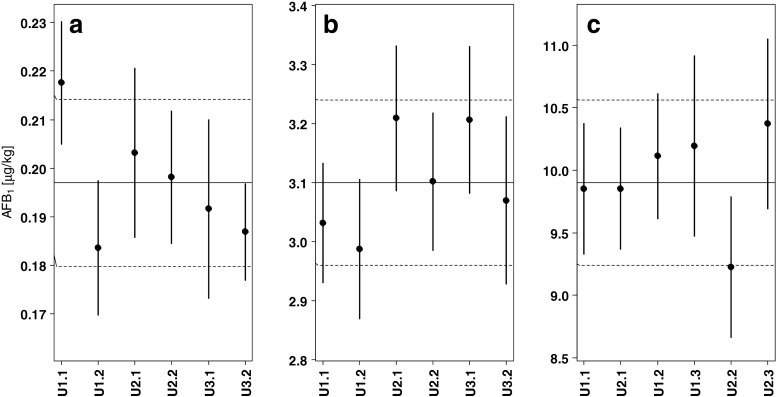
Fig. 5.
Distributions of the results of the six test units per PT material: a baby food, b maize, c feed; y scale has been adjusted such that the expanded uncertainties of the assigned values have equal width, x labels identify test unit number and repetition (U1.1: unit one, first repetition); solid circle result, vertical lines expanded uncertainties, horizontal solid line assigned value, horizontal broken lines expanded uncertainty of assigned value

