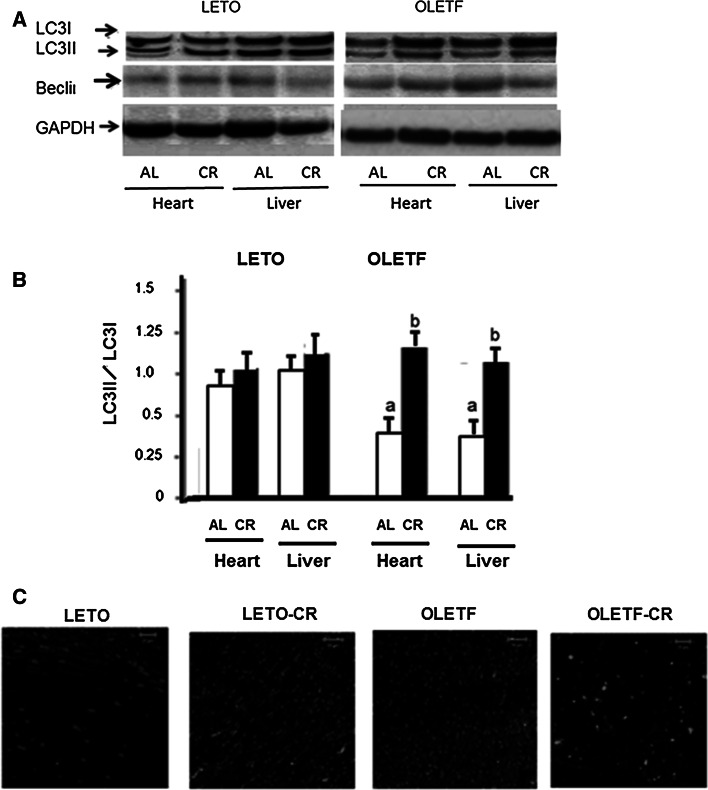
Fig. 7.
Western immunoblotting for light chain 3 (LC3) and beclin1. a Representative Western immunoblots showing the expression of conjugated (LC3-II), cytosolic (LC3-I) LC3, beclin1 and GAPDH. b Densitometric analysis of beclin1 and the LC3-II/LC3-I ratio. Data are the mean ± SE of 5 experiments. a p < 0.05 versus LETO-AL rats; b p < 0.05 versus OLETF-AL rats. c Immunofluorescent study of LC3 protein levels in the heart sections with green signals indicating LC3 deposition. Original magnification, ×630. DAPI staining was performed as counterstaining

