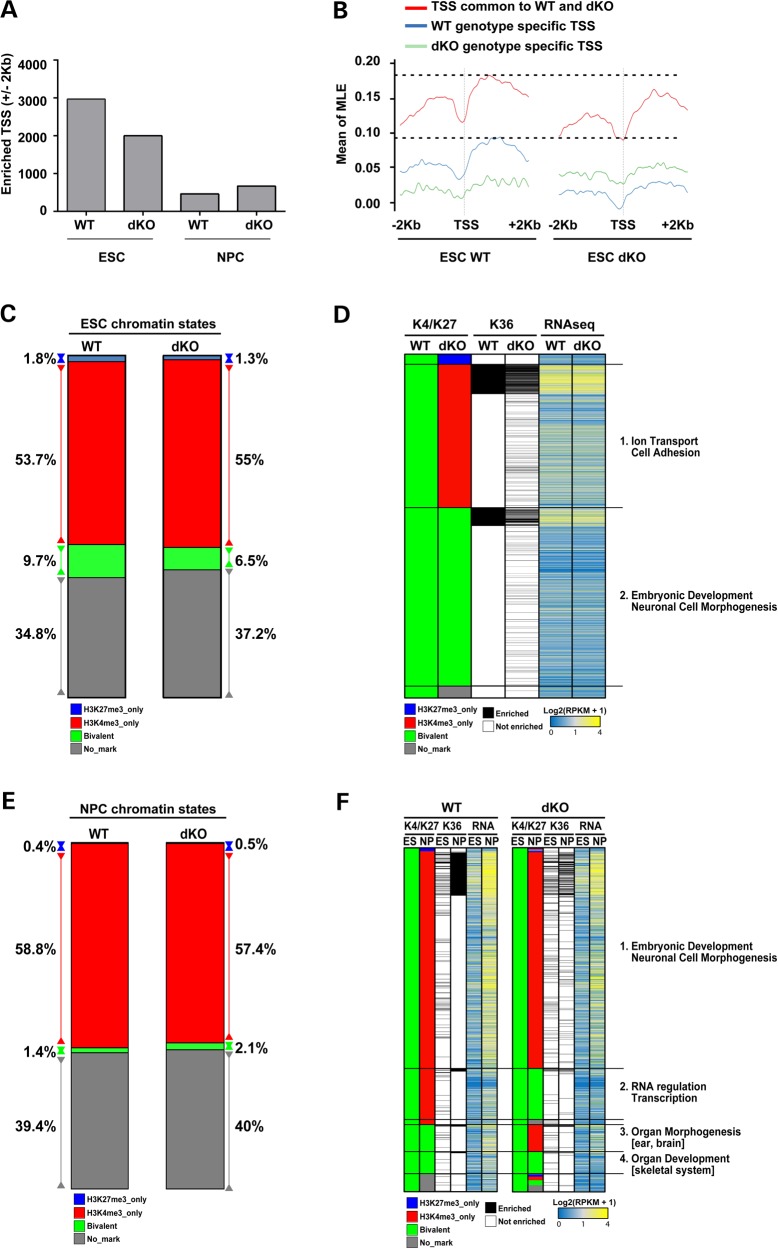
Figure 4.
Htt null mutation predominantly affects histone H3K27me3 at ‘bivalent’ loci in ESC and NPC. (A) Bar graph of the total number of TSS with histone H3K27me3 enrichment (scaled ChIP read counts over input control using threshold 4 as described in Materials and Methods) in a region of ±2 kb around the TSS, for the Htt wild-type (WT) and Htt null (dKO) ESC and NPC lines. Supplementary Material, Figure S3C and D presents the TSS data for all of the other assessed histone marks for all of the members of the isogenic Htt allelic ESC and NPC series. (B) Metagene profiles displaying the average of TSS histone H3K27me3 enrichment (scaled ChIP read counts over input control exceeding threshold 3—see also Materials and Methods) in a region of ±2 kb around the TSS in Htt wild-type and Htt null ESC. TSS enriched for H3K27me3 in both genotypes are depicted in red. TSS enriched only in wild-type are given in blue. TSS enriched only in Htt null ES are depicted in green. Y axis shows mean of smoothed maximum likelihood enrichment estimates (MLE) for the groups of genes in each category (red, blue and green). (C) Bar plot depicting the fraction (as percentage) of the total TSS (N = 30 489) analyzed that are classified as ‘repressed’ (histone H3K27me3 only), ‘active’ (histone H3K4me3 only) or ‘bivalent’ (histone H3K27me3 and histone H3K4me3) for Htt wild-type (WT) and Htt null (dKO) ESC lines. (D) Composite heatmap plotting (in rows) the 2949 loci with TSS classified in Htt wild-type (WT) ESC as ‘bivalent’ to illustrate their chromatin status in Htt null (dKO) ESC. The adjacent columns show the corresponding histone H3K36me3 enrichment calculated over the gene body and the RNA-seq expression levels as Log2(RPKM+1) values. The major GO terms highlighted by pathways analyses for the subsets of loci with Htt null sensitive TSS enrichment (Category 1) and Htt null insensitive TSS enrichment (Category 2) are given (further details on the categories are provided in the Results). (E) Bar plot depicting the fraction (as percentage) of the total TSS (N = 30 489) analyzed that are classified as ‘repressed’ (histone H3K27me3 only), ‘active’ (histone H3K4me3 only) or ‘bivalent’ (histone H3K27me3 and histone H3K4me3) for Htt wild-type (WT) and Htt null (dKO) NPC lines. (F) Composite heatmap plotting (in rows) the 1525 TSS that are classified as ‘bivalent’ in both Htt wild-type (WT) ESC and Htt null (dKO) ESC with the adjacent column indicating their chromatin status in their cognate NPC line. The corresponding paired ESC and NPC histone H3K36me3 enrichment and RNA expression levels, as Log2(RPKM+1) values, are in the adjacent columns. The major GO terms highlighted by pathways analyses for the subsets of loci with Htt null insensitive TSS enrichment (Categories 1 and 4) or Htt null sensitive TSS enrichment (Categories 2 and 3) are given (further details on the categories are provided in the Results). Supplementary Material, Figure S3 reports ChIP-qPCR confirmation of selected Htt null TSS changes in ESC and NPC.

