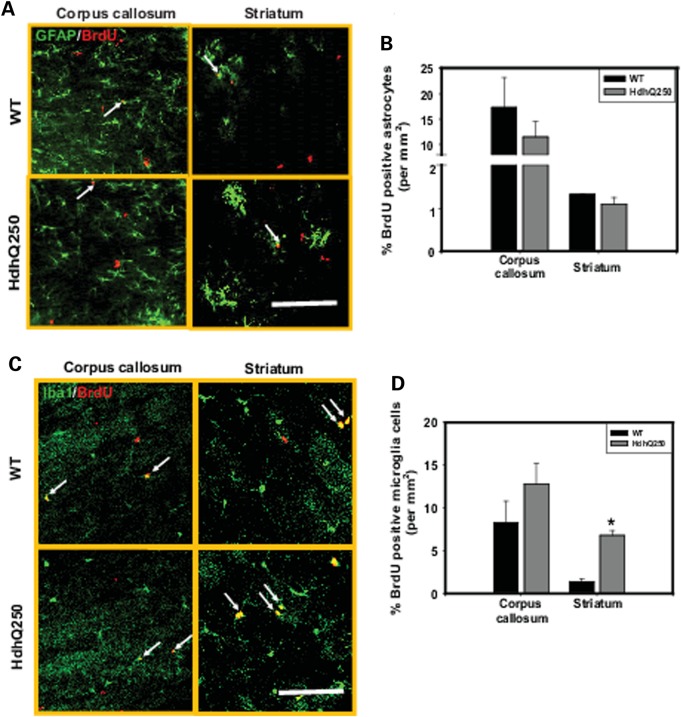
Figure 8.
None-oligodendrocytes glial cells proliferation in the corpus callosum and striatum of HdhQ250 mice. (A) Representative GFAP and BrdU co-immunostaining images in the corpus callosum and striatum of 9-month-old HdhQ250 mice and control wide-type (WT) mice. Scale bar = 100 um. (B) Percentage of proliferating astrocytes in the corpus callosum and striatum of HdhQ250 brain and wild-type (WT) mice. (C) Representative Iba1 and BrdU co-immunostaining images in the corpus callosum and striatum of 9-month-old HdhQ250 mice and control wide type (WT) mice. Scale bar = 100 um. (D) Percent of proliferating microglia in the corpus callosum and striatum of 9-month-old HdhQ250 mice and WT mice. *P < 0.05 versus control group by standard Student t-tests, n = 3.

