
Figure 1.
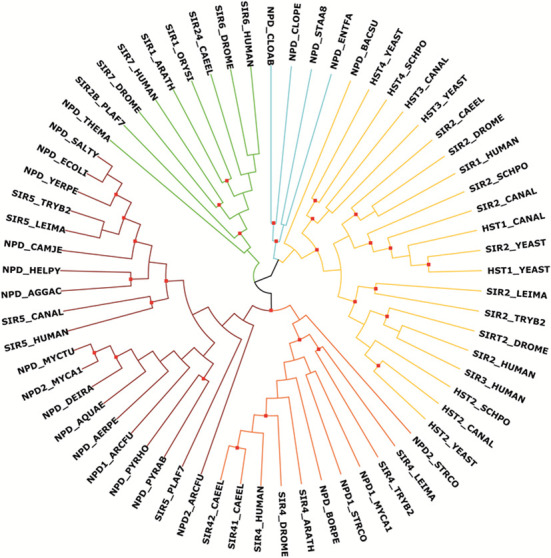
Maximum likelihood cladogram of the sirtuin superfamily. Maximum likelihood (ML) analyses of selected sirtuin family members resulted in 12 trees with two distinct topologies for the main classes I-IV and U, suggesting either classes II and III or classes II and VI to be sister clades. The tree topology with highest branch support is shown. Branches are colored according to families: class I = dark yellow, class II = orange, class III = red, class IV = green, class U = cyan. Branches with aLRT SH-like support values of 0.9 or higher are marked by a red dot. Methods: 65 sirtuin protein family members from 33 species were aligned with MAFFT (21) (version 7; parameters: L-INS-i, JTT200). From the alignment, we selected manually homologous regions using the alignment editor Jalview (22); three data models were created with a length of 238, 220 and 193 amino acids, respectively. The best fitting model of protein evolution was determined with ProtTest (23) (version 3.2; parameters: fixed BIONJ tree calculated under the JTT model of amino acid substitution; rate variation; amino acid frequencies to be the LG model plus gamma distribution). Maximum likelihood (ML) phylogenies and ML consensus trees from 100 bootstrap replicates were inferred with PhyML (24) (version 3.0) and RAxML (25) (version 7.2.8). The tree was visualized with Archaeopteryx (https://sites.google.com/site/cmzmasek/home/software/archaeopteryx). Protein sequences and multiple sequence alignments are provided in supplementary file S2.