
Figure 3.
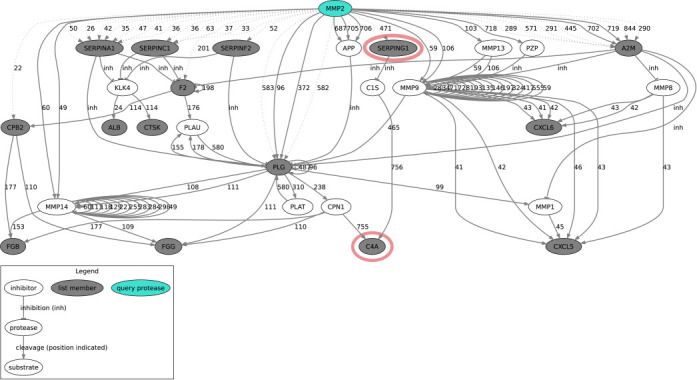
Fragment of the graphviz figure of protease web connections identified by PathFINDer. Nodes are proteins, the query protease is marked in color and the proteins from the submitted list are gray. Edges are cleavages (arrows, with numbers for the position of the cleavage) or inhibitions (T shaped arrows, labeled as ‘inh’). Edges from TopFIND are solid and edges inferred from the list are dotted. Nodes from the complement system are marked with red.