
Figure 5.
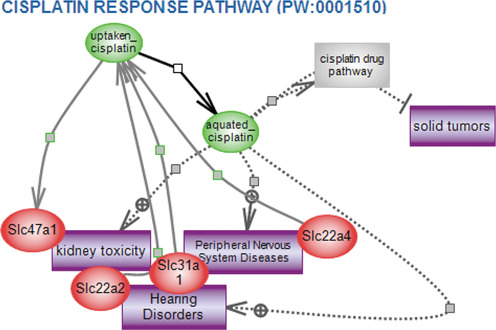
Cisplatin response pathway. RGD's interactive pathway diagrams give a detailed and intricate view of a growing list of regulatory, signaling, metabolic, disease and drug pathways. The page begins with an overview of what is known about that pathway (not shown in this figure), and a diagram showing the various players and their interactions and relationships in the functioning of the pathway. Disease pathways and altered pathways show the details of what can go wrong with a specific interaction to cause a breakdown in the function of the network. Pathway pages also give information about the other pathways, diseases and phenotypes with which the members of a particular pathway are associated.