
Figure 6.
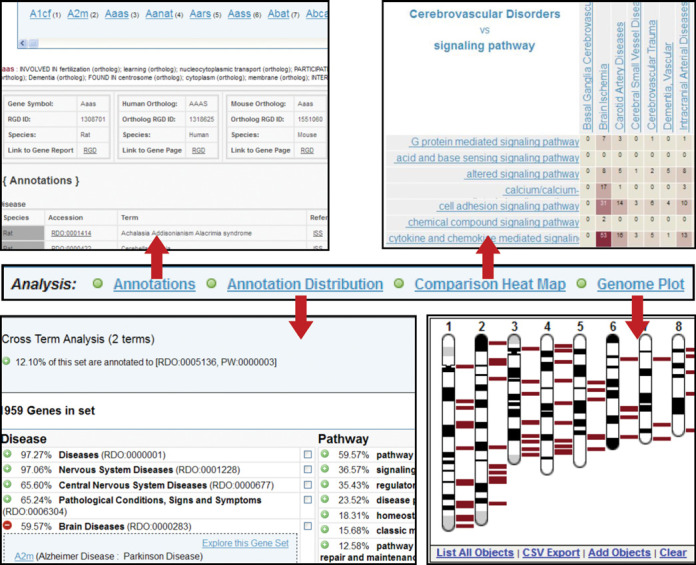
The Gene Annotator Tool. Shown in the center of the figure is the menu bar from the Gene Annotator (GA) tool. The default result is the ‘Annotations’ page (top left), which gives detailed lists of annotations for each gene in the input list and its corresponding orthologs, as well as a list of external database identifiers for that gene with links to additional information at the other databases. The ‘Annotation Distribution’ analysis (bottom left) indicates the percentage of genes in the input list associated with lists of disease, pathway, phenotype, biological process, molecular function, cellular component and chemical interaction terms, beginning with the terms that appear most commonly. Selecting a term shows the subset of the input list of genes that are associated with that term or any more specific term beneath it in the ontology. Check boxes allow the user to select multiple terms within one or across multiple ontologies to see the genes with annotations to all the selected terms. This smaller subset of the original list can then be entered into the GA Tool for further analysis. The ‘Comparison Heat Map’ function (top right) allows users to select any two ontologies, or to view the overlap between two branches of the same ontology. In this case, the number of genes from the original input list which are associated with disease categories under ‘Cerebrovascular Disorders’ and pathway categories under ‘signaling pathways’ are shown, with intersections containing a higher number of associated genes displayed as increasingly darker colors. Finally, the ‘Genome Plot’ (bottom right) shows the location of each gene in the list against the full set of chromosomes for the species, in this case, the rat karyotype, with the chromosomal positions for all the genes in the list presented in a table below the image (not shown). Functionality for the Genome Plot is the same as that described earlier for the Genome Viewer tool.