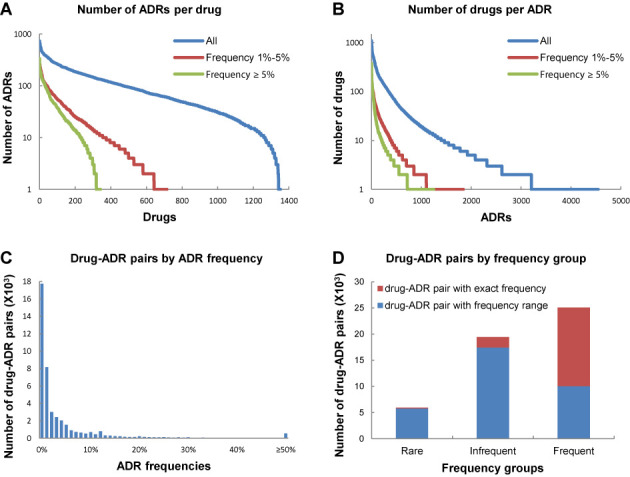
Figure 3.

Statistics of ADReCS. (A) The number of ADRs counted by drug with frequency thresholds of 1%–5% (red, 717 drugs), above 5% (green, 344 drugs) and all (blue, 1355 drugs), respectively. (B) The number of drugs counted by ADR with frequency thresholds of 1%–5% (red, 1842 ADRs), above 5% (green, 1250 ADRs) and all (blue, 4545 ADRs), respectively. (C) Statistics of drug–ADR pairs by ADR frequency. (D) Statistics of drug–ADR pairs by ADR frequency group. The drug–ADR pairs were classified into three groups: Rare (frequency thresholds of <0.1%), Infrequent (frequency thresholds of 0.1%–1%) and Frequent (frequency thresholds of >1%).
