
Figure 3.
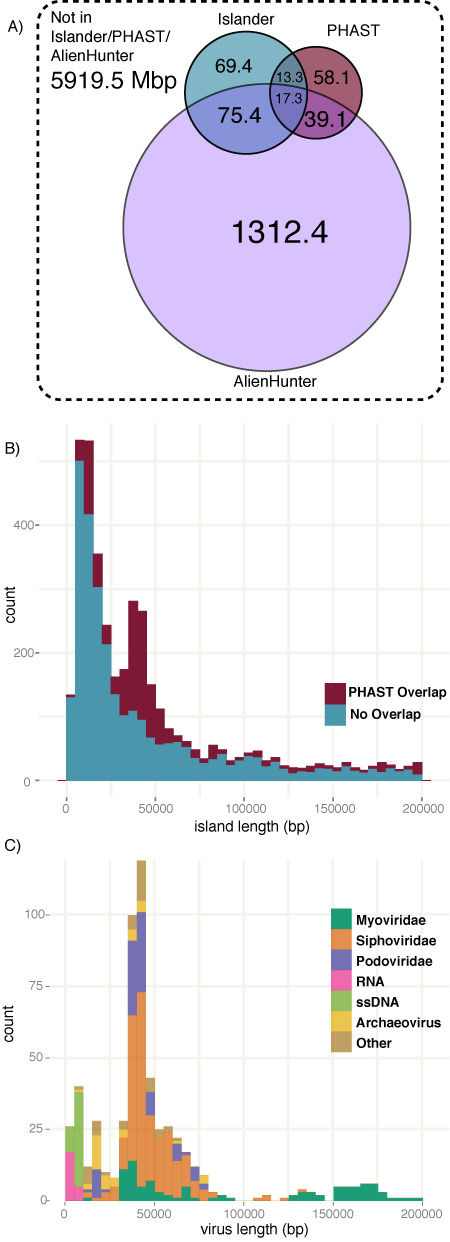
Island overlap. (A) DNA length overlap for the outputs from Islander, PHAST (prophage finder) and Alien_hunter (anomalous composition finder). (B) Size profile of Islander islands. For each island, overlap by at least 10% with PHAST regions was determined. The peak at 13.6 kbp has both PHAST and non-PHAST components, while that at 39.9 kbp is primarily from the PHAST-labeled islands. (C) Size profile of RefSeq prokaryotic viruses, broken down by high-level taxonomic group, matching both peaks of panel (B).