
Figure 1.
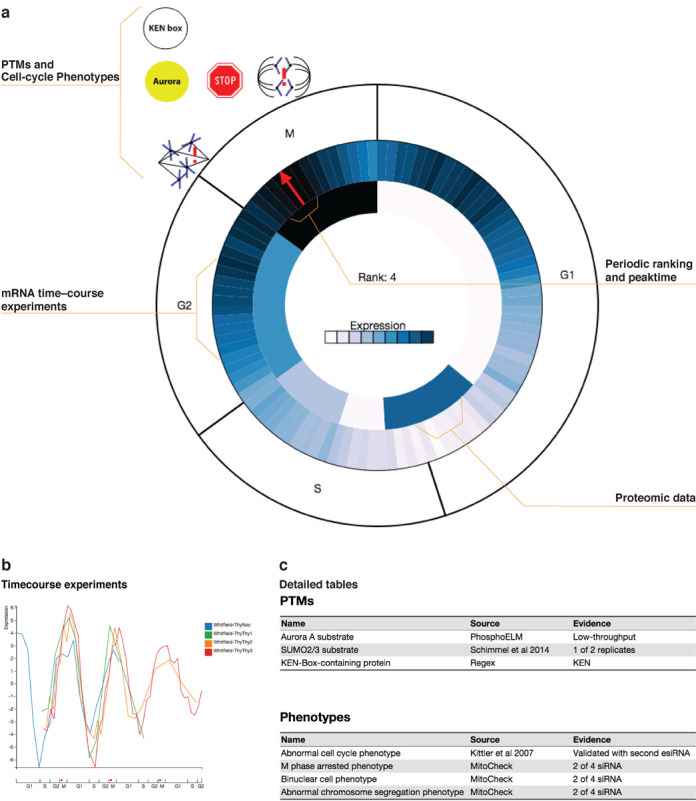
Overview of cell-cycle regulation and phenotypes. (a) A key feature of Cyclebase 3.0 is the new visualization, which aims to provide a concise overview of cell-cycle regulation and phenotypes for a gene. (b) For a more detailed view of the transcriptomic data, we normalize and align the individual time course studies, to allow all expression data for a gene to be plotted on a common time scale (percentage of cell cycle). (c) Further detail on PTMs, degradation signals and organism-specific phenotypes is provided in the form of tables with linkouts to the original sources whenever possible.