Figure 3.

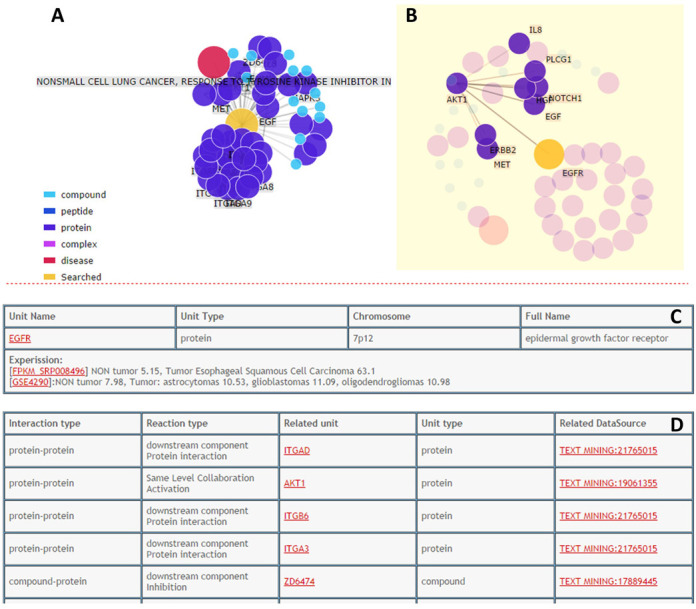
Query result for EGFR. (A) Network viewer to show the proteins, drugs and diseases related to EGFR and the interactions among all of them. (B) When the node in the network is selected, all the directed partners are highlighted to facilitate users to investigate the function of specific node; double click will return to the original network. (C) The annotation table for queried entry. (D) The interaction table for all related information.
