
Figure 1.
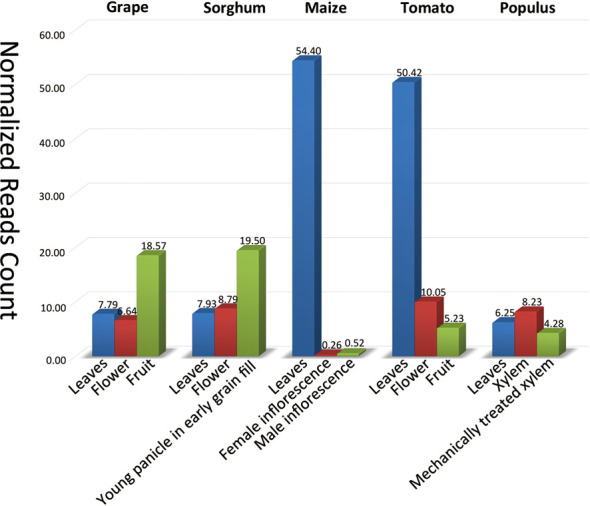
The expression profile of the MIR156 family in five species: grape, sorghum, maize, tomato and Populus, respectively. The x-axis represents different tissues in one species while the y-axis represents the normalized reads count of miR156 in corresponding tissue. The read counts were calculated by the localized miRanalyzer toolkit.