Figure 3.

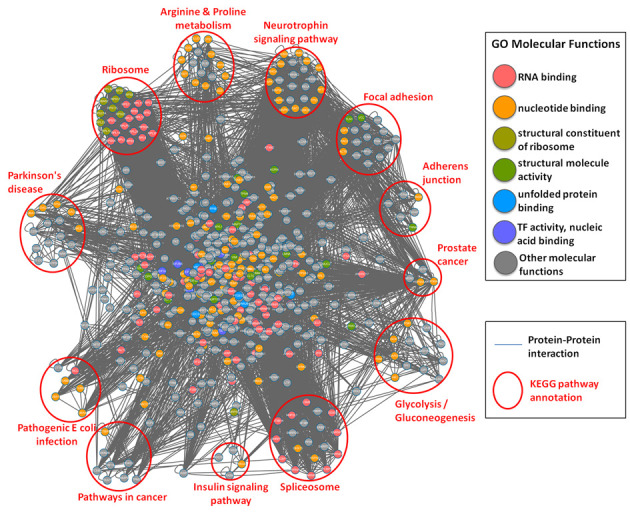
Protein–protein interaction network of all human S-nitrosylated proteins with the annotations of GO molecular function (marked in different colors) and KEGG metabolic pathways (clustered in different pathway groups).

Protein–protein interaction network of all human S-nitrosylated proteins with the annotations of GO molecular function (marked in different colors) and KEGG metabolic pathways (clustered in different pathway groups).